
10 Surveys and Questionnaires
Chris Bailey, PhD, CSCS, RSCC
There are many methods to collect quantitative data and surveys & questionnaires should not be forgotten. They can often be much more affordable than other methods and if created and administered appropriately, can be just as valuable as any other method. While many items on a survey might be subjective or even qualitative in nature, their coding is often objective, which means it can be quantified and analyzed.
Chapter Learning Objectives
Type your learning objectives here.
-
Understand the methodology of creating and administering useful surveys & questionnaires
-
Learn to produce actionable data and analysis from surveys & questionnaires
-
Examine issues related to survey & questionnaire sample selection as well as methods to avoid them.
Surveys versus Questionnaires
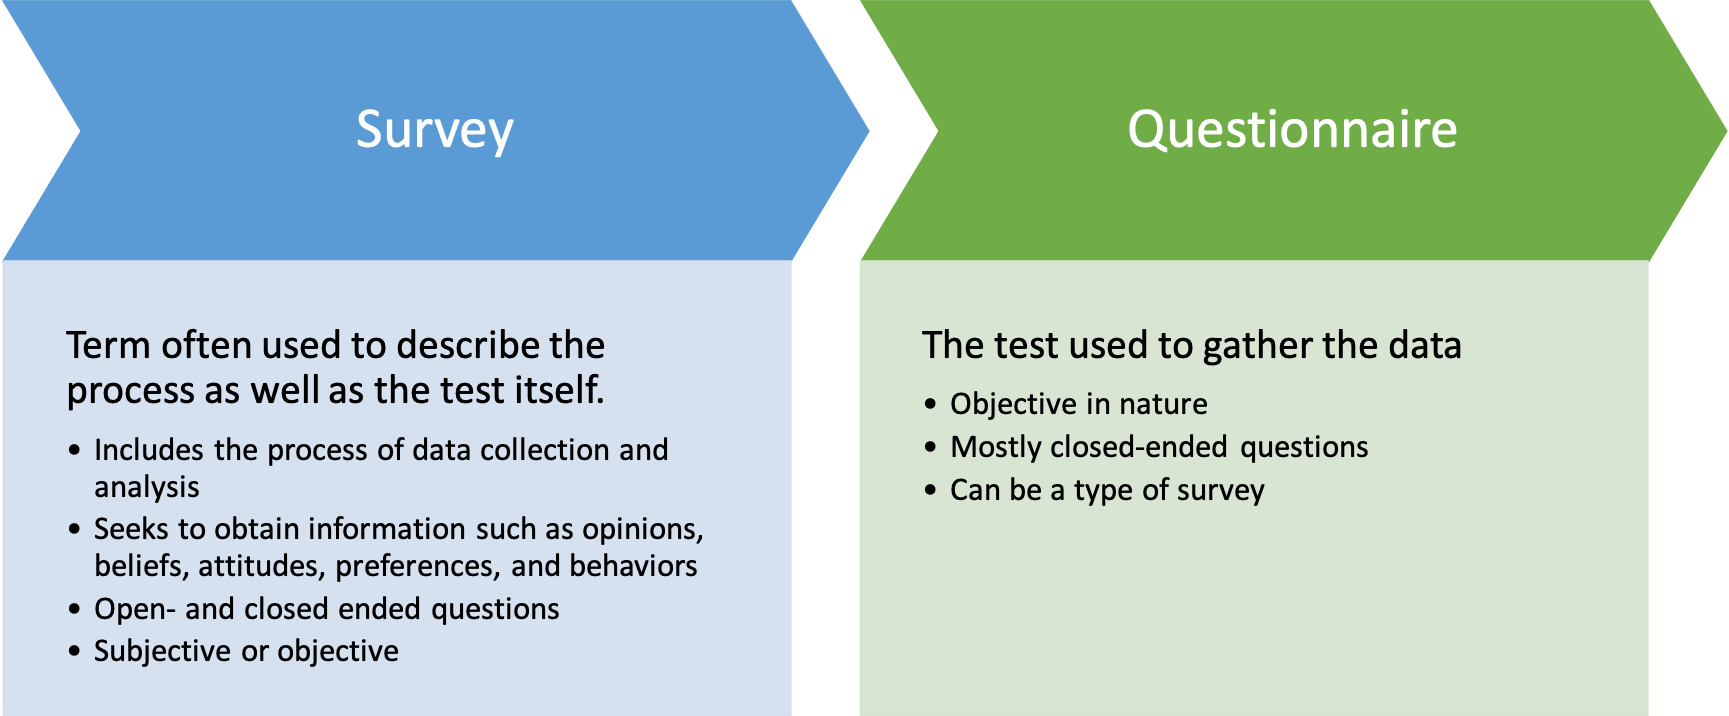
While the terms Surveys versus Questionnaires are often used interchangeably, they are, in fact, different. A questionnaire is actually a type of survey, but not vice versa. A survey may be describing the tool used to collect data, which could also often be called a questionnaire. But surveying is the process of data collection and analysis. Surveying seeks to collect data on opinions, beliefs, attitudes, preferences, and even behaviors. A survey may obtain this information via open- and closed-ended questions. As such, it can be either subjective or objective. A questionnaire on the other hand is simply the tool used to collect data and will be objective, because it utilizes closed-ended questions.
Given the ease of creating quantitative information from an objective questionnaire, it will be easier to incorporate it into this text. That doesn’t mean that we can’t create quantitative information form open-ended and subjective responses. If you remember back to one of our earliest chapters, an example of text-mining analysis was discussed and semantic analysis based on the type of language used to produce quantitative information from qualitative attributes. That was a method of creating quantitative information from a large amount of text. We won’t do that in this textbook, but I encourage you to investigate that approach if this type of research interests you.
Process of performing survey research
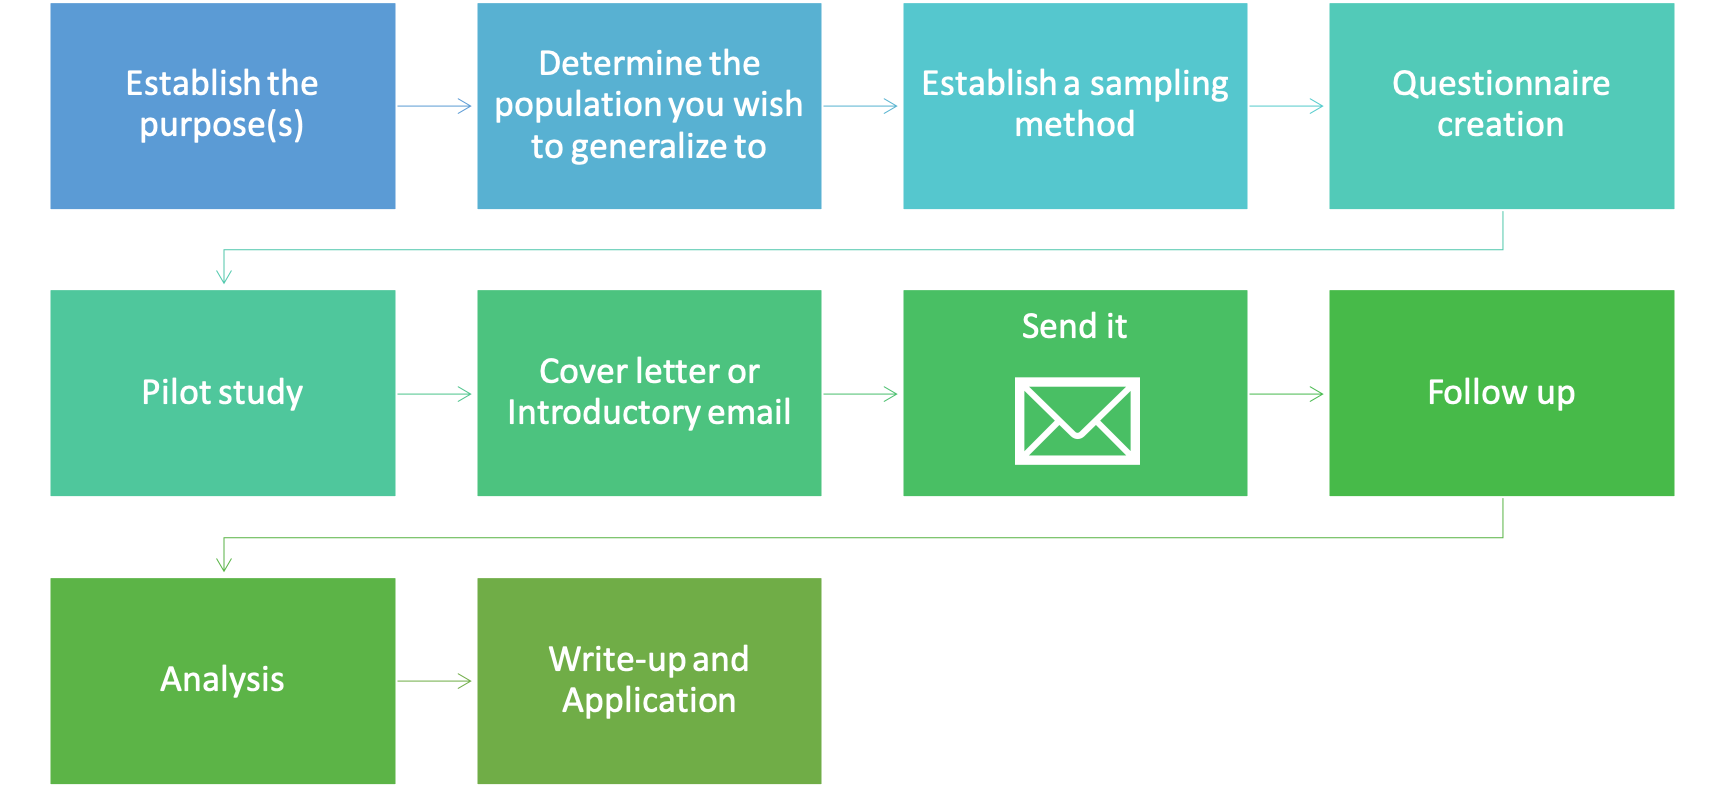
The process of performing survey-based research is similar to other forms of research, except you have to create and validate your tool for collecting data. So, it does have a few more steps than other forms of research. We must begin with a purpose or research question. Next, we need to know who the answer of our research question is going to be generalized towards in order to avoid selection bias issues. We’ve discussed selection bias previously, and in order to avoid that, we must think about this step carefully. The population who we want to generalize to must match the individuals we actually collect data from. We can only make practical applications and generalizations related to those that were included in our sample. Next, we need to determine our sampling method. Randomization is very important in all types of research in order to avoid bias and error, and survey-based research is no different. We will discuss this in greater depth later. Now it’s time to create the actual tool used to collect the data, the questionnaire. As we will see later, not all questionnaires are created equally and some don’t provide much useful data. So, we will look at some tips to make sure we get the most out of each item used in the questionnaire. As mentioned previously, you must validate any new questionnaire and we do this with a pilot study. Reliability will also be evaluated in this step. If the questionnaire has previously been validated and published, this step may not be necessary, which would make the process quicker. But, keep in mind that it must be validated in the population you are hoping to generalize to. Even if it was previously validated, if the validation was done on college-aged individuals and you are testing seniors, you will need to redo the validation. Next you need to create a concise introduction or cover letter to be sent out with your questionnaire. This is the point where you are trying to convince the potential study participants to complete the questionnaire, so you must explain your study, what you hope to gain from it, any risks in participating, and if participants will receive any incentive. The main risk here is loss of confidentiality, but that can be negated if you are anonymizing your questionnaire results. Now you can finally send the questionnaire out. But you aren’t done. More than likely, participants will need a reminder to complete it. Most won’t do it immediately, so a follow-up communication is necessary. Now we can analyze the results and produce some form of a write-up or presentation along with meaningful practical applications.
That was actually a quick summary of the necessary steps. We will go more in depth into each of these steps below. Please keep in mind that this is an introduction to survey based-research and the actual process will be much more intensive.
Sampling Methods
After creating a purpose and selecting the population you want to generalize the results to, you need to determine the sampling method to be used. Only in rare cases will you be able to test the entire population, so selecting a sample of that population is likely more realistic.
Random sample: Each individual in a population has the same chance of being included
When selecting a sample, there are many things we may unknowingly do that will bias our results and we should try to avoid doing that by getting a random sample. If our sampling is truly random each person in a population will have the exact same chance of being included in the study. For example, let’s say we want to evaluate the attitudes and opinions on different areas of kinesiology in a student population. If we had access to the American College of Sports Medicine (ACSM) student directory, we could randomly select 100 participants to make up our sample from that directory. Usually this is accomplished by a software program as we might bias the results if we were in charge of selecting the students.
Stratified random sample: The population is divided into groups and then randomly samples from each group are taken
Another option is a stratified random sample. A stratified random sample is one that was split into groups prior to the random sampling. After the population was subdivided, random sampling could be completed on each of those groups. Carrying on with the previous example, we might subdivide our population into undergraduate students, masters' students, and doctoral students. The reason this might be done is so that each sub-group’s voice could be heard. In general, there are a lot more undergraduate students than graduate students. If that were the case in our ACSM student population, we would be more likely to randomly select undergraduate students, leaving other groups under-represented, and we might not see their perspective in the results. Subdividing the population first and then randomly selecting students from those groups will ensure that each sub-group is represented.
Systematic random sample: Uses a pre-planned interval (i.e., every 20th person) within the population, but is still considered random
Another option is utilizing a systematic random sample. This method is not used as often, but still exists. In this method, the sample could be selected based on a pre-planned interval. For example, in an alphabetized directory of 2,000 students, selecting every 20th person would give us a sample of 100 students. Similar to our previous option, this option could help us avoid under- and over-representing specific groups by making sure that names all across the alphabet are selected, which will increase diversity in our sample. This is systematic, but is still considered random.
Convenience sample - Utilizes those you have the most access to which largely increases the chance of selection bias and may produce coercion
The final option is the most common form in most fields of study involving human subjects research. A convenience sample is one that utilizes those that the researcher has the easiest access to. You may or may not be aware, but college aged individuals are the most common subjects in human subjects research. Why do you think that is? Most research happens at colleges and universities by professors who recruit students as participants. This is not necessarily an issue, but if the professor(s) wants to generalize the results to older or younger individuals, it will be a selection bias issue. One common issue observed related to this in health and exercise science is that younger college aged individuals are healthier than older individuals and this complicates the generalization capability of the results in many fitness related studies. Another potential issue with utilizing a convenience sample is the concept of coercion. All study participants must volunteer to be in a study. If a professor recruits students from a class that they are teaching to be in their study, students may feel added pressure to participate thinking that the professor may think more highly of them or that it may influence their grade in the course. Whether or not this perceived pressure is real, doesn’t actually matter if it caused someone to do something they would not have otherwise done. This issue is not specific to university research with students. The same thing could happen in a professional setting with coworkers, or anytime a convenience sample is used when there are previous relationship and power dynamics that need to be considered.[1]
Questionnaire Creation
When creating the questionnaire, length may be one of the most important considerations. The general rule of thumb is the shorter the better. This pertains to question length as well as to the overall length of the questionnaire. Shorter questions are easier to understand, so they should be used. Questionnaires that have fewer items to complete are more likely to be returned and completed, so keeping them short is recommended.[2] That being said, we know that tests and questionnaires with more items are more reliable, so you must find a compromise here.[3] Make your questionnaire as short as possible, as long as it still maintains a high level of reliability (which will be checked in a later step).
You should usually, primarily, avoid modifiers most of the time.
There are many things that should be avoided when constructing a questionnaire. While we use modifiers often when we speak, they can confuse people in writing. You can see a particularly bad example of this in the quote above. While it is truthful, it is also confusing. Questions should be kept simple. If they have compound ideas, they are opened up to different forms of interpretation which will modify the results. Keep technical language out of the questionnaire unless you are surveying experts from that particular field. Similar to compound and complex questions, negatively worded questions may also confuse readers. One final thing to avoid is any form of cueing or leading participants to an answer, which is a straightforward form of bias.
Many times, questionnaire drafts are filled with yes/no or true/false questions and items. This initially makes sense because they will be easy to quantify. For example, “83% of participants surveyed answered in this manner.” This is okay, but if the questionnaire only has dichotomous answer choices, descriptive statistics will likely be the only form of reporting that can be complete. If the questionnaire had other forms of items such as a Likert scale producing numerical data (mostly agree = 5, agree = 4, neither agree nor disagree = 3, disagree = 2, mostly disagree = 1) or some form of numerical slider input, you can get more precision. In fact, one could use one of the previous yes/no questions to group the sample and then compare the means of the of a numerical input answer question with a t test or another procedure we’ve previously discussed. For example, this type of questionnaire might lead to a conclusion that “participants who were in favor of x were statistically more likely to …” This would combine multiple questions to create a conclusion but keeps questions simple for the participants. The research question you are trying to answer should always be kept in mind in order to make sure questions set you up for success in order to answer it.
Pilot Study
Much like in any other form of research, pilot study is important to make sure data collection will run smoothly. It has an additional purpose in survey research in that the questionnaire is often validated in this step. As mentioned previously, all new questionnaires must be validated. A previously validated questionnaire may not need to be validated, but it will be if it is being used on a new population. Validation is a key step and it is similar to the validation of any other new tool used to collect data. Reliability can also be evaluated during the pilot study.
Validity, Reliability, and Item Reduction
Validity
Overwhelmingly, the biggest concern in survey research is whether or not the questionnaire is valid. If it isn’t, the data is garbage. There are several ways to create valid questionnaires and starting with the creation of high-quality items and questions that are connected to your overall objectives along with pilot testing. Questionnaires must also be validated by an expert for content or face validity. This is accomplished by reaching out to another expert in the area and asking them to examine your questionnaire to make sure it will be able to help you answer your research question. They can then provide you feedback on each item as well as suggest others. It is important that they not be involved in any other aspect of the study so that they remain unbiased. One final way to improve questionnaire validity is to ensure that all data is confidential and to let participants know that it is. If it is possible to make it completely anonymous, let them know that as well. People are more likely to be honest when they know their responses are anonymous, so there is no fear of judgement from their peers.
Reliability
Much like when reliability was measured previously, at least 2 trials are needed to evaluate it. This likely means the questionnaire must be administered 2 times. It is possible to ask the same question twice in the same questionnaire, but it is often better to administer it on 2 different occasions. Reliability analysis will happen at the item level, so it is possible to have some items with great reliability and others that have poor reliability. As it is difficult to get most to complete a questionnaire twice, this step generally happens during pilot study with a smaller sample than the actual study.
Questionnaire Item Reduction
There is a statistical procedure to reduce the number of questionnaire items when necessary. The statistical procedure is called a factor analysis. It is largely based on the correlation. If a questionnaire has several similar questions that elicit similar responses, it may be because they are evaluating a similar underlying construct. If that is the case, some of those items are redundant and can be removed. It is important to evaluate the construct, but 10 questions evaluating the same aspect likely is not necessary. To be clear, this is a statistical procedure, and it won’t be able to identify what the construct is. But it might report that questions 1,5,8,9,13, & 23 are all somehow similar. This likely means that they are loading on the same construct or "factor." It would then be necessary to evaluate all those questions to determine what that similarity is and then name the specific factor. This textbook will not introduce this procedure, but an example will be provided below. This process should be done before you officially send out the questionnaire, so it will likely occur during the pilot study step. But that doesn’t mean everyone does a factor analysis for item reduction. In fact, most will not. This is one option if one has a very long questionnaire and would like to shorten it.

The example above shows results from a factor analysis on a questionnaire which was used to evaluate the stresses impacting collegiate athletes at an NCAA Division 3 level university of several sports.[4] A 24-item questionnaire was initially used, but it could be reduced to 9 items if only one measure was used for each factor. You can see the results indicated by the newly named factors and their background color or pattern overlaying the questionnaire item number. What you may also find interesting is that there were some items that did not load on any factor or share any variance with another item. This is actually a bad thing if they aren’t independently evaluating an important factor in the study. As such, you can see 3 questions were removed from the study (indicated by strikethrough text, but without any overlaid pattern or color) since they weren’t of value.
Cover Letter, Administration, & Follow-up
After the pilot study and successful validation, it’s time to construct the cover letter or the introductory email that will be sent along with the survey. This will also appear as the first page of your questionnaire or as the body of the email sent along with the link to the questionnaire and often on the first page of a digital questionnaire. Here it is very important to explain the study and get the participants interested in participating. You must explain why the study is being done, any risks and how they are being minimized, any benefits and any incentives you are providing if they participate.1 Most are more likely to do a questionnaire if they are getting something out of it. For example, would you rather participate because you are advancing scientific knowledge or because you might win a brand-new iPad?
Since getting 100% participation is unrealistic, you should already be planning to follow-up with potential participants. This email can be shorter than the original since you’ve already conveyed the necessary information. Even if they didn’t read the initial email, they will still see that information at the beginning page of the questionnaire. Following up can be completed as many times as desired, but there likely is a point when there won't be much return on investment. The average response rate on surveys is 33%, so that should be the minimum target if there is one. The more the better, so always strive to get higher values as that will increase the quality of the data.[5]
Why don't they participate?
Imagine sending out your questionnaire and you didn’t get the response rate you hoped for. Why did that happen? Here are some common areas that can be improved. First is the cover letter or project description. If this was too long or it didn’t convey enough information in the first few sentences, you likely lost participants quickly. Once they begin the questionnaire, if it is unorganized or hard to follow, some may not complete it. Length is also very important here. Incentives are a great way to drum up responses. It would be rare that you could give everyone that participates in your study some type of incentive, so most will follow the raffle model and give one or a few participants something. If you follow this model, the incentive still needs to be worthwhile. Participants understand that it is still unlikely that they will win the raffle, so the incentive must outweigh the perceived improbability of winning. Next, if unrealistic or rapid return deadlines are set, you might lose even more people. Everyone is busy and they have their own lives and schedules to worry about. Setting a deadline is important, but it shouldn't be too quick. Finally, don’t forget to follow-up and most likely follow-up again. Each time you do your responses will go up.
Pros and Cons of Survey-Based Research
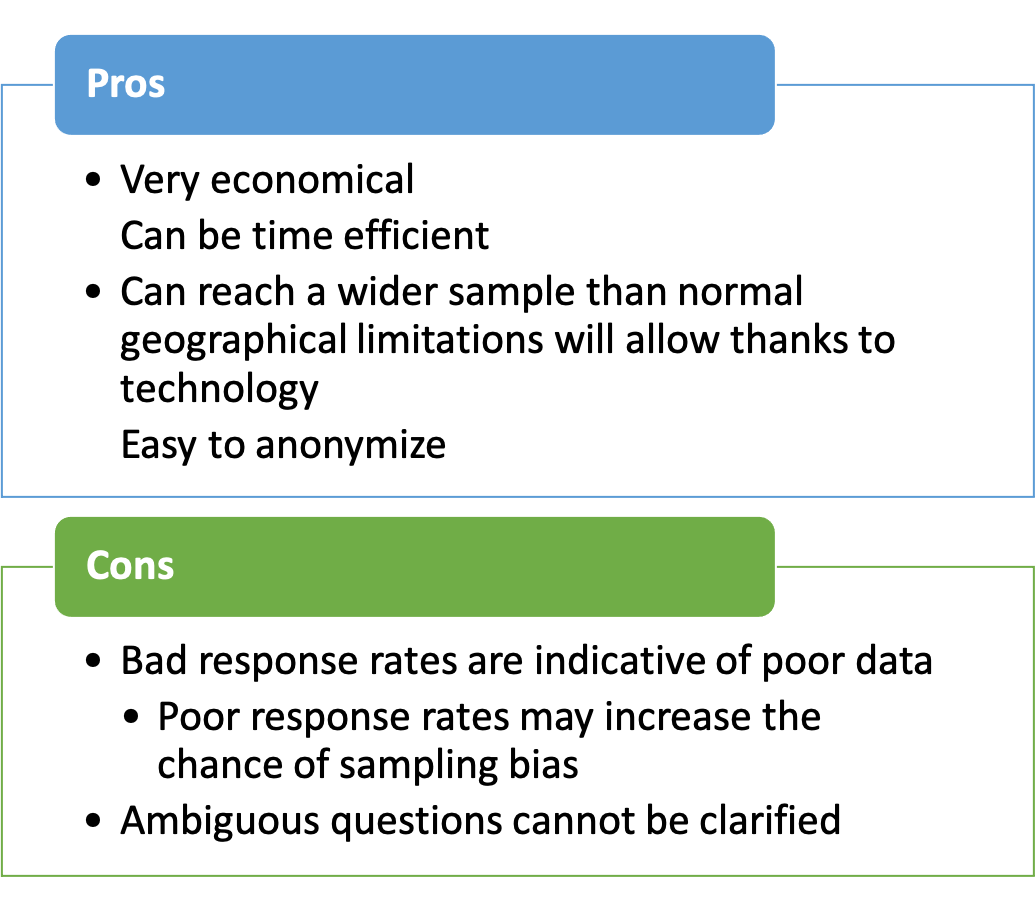
As with anything else, there are pros an cons to doing research with questionnaires. One of the biggest advantages is that it is usually very cost efficient. Surveys and even survey administration and analysis software/service can be very cheap. Depending on the questionnaire setup, it can also be very time efficient. Another big advantage is that a very wide geographic area can be reached compared to what you are limited to nearby (assuming the questionnaire is being delivering electronically).
There are also some disadvantages. It is often very difficult to get someone to complete a questionnaire. This issue is especially tough when the only mode of contact is email as people are more likely to do something if you ask them personally. You will need to report your response rate in the results. So this can diminish the data’s value if the response rate is poor. If a small number of those invited participate, the chance that bias exists in a sample likely increase since the number is small. Another disadvantage is that if participants have questions about items, there is no way for them to ask. This makes the questionnaire item setup stage even more important.
Other forms of Survey-Based Research
There are other forms of collecting data in survey-based research besides the questionnaire. Interviews and focus groups are good examples of these. These have some key advantages compared to questionnaires. They are more adaptable as the interviewer can make changes or clarify questions as needed. They also have much better response rates as most people will respond in person. There are some key disadvantages also. The interviewers body language can lead the interviewee to respond a certain way. If you want to experiment with this, ask a friend a seemingly straightforward question. They will likely answer and stop talking when they have sufficiently answered the question. But just keep staring at them and don’t give them any feedback. They will likely start explaining their answer again in further detail because your lack of a response was taken as either confusion or disagreement. You can also try making visually affirmative or disapproving faces at someone while they are answering a question. You can often get them to change their answer direction without saying anything. Another disadvantage is that they don’t really yield quantitative information or data immediately. They take a lot of post interview processing and work to identify and code responses so that they can be analyzed. Given their lack of readily available quantitative data, they will not be discussed in depth in this textbook. One final disadvantage comes from focus groups or group interviews. There is often one or a couple of participants that do the majority of the talking. So we don’t actually know that the more quiet members in the group agree with them, we just know they aren’t’ speaking.
Practical Example of Using Questionnaire-Based Data
| RPE | Explanation |
|---|---|
| 1 | very easy |
| 2 | easy |
| 3 | |
| 4 | |
| 5 | Hard |
| 6 | |
| 7 | Very hard |
| 8 | |
| 9 | Extremely difficult |
| 10 | Max effort |
[asciimath]"Session RPE Training Load"=RPE*Duration("in minutes")[/asciimath]
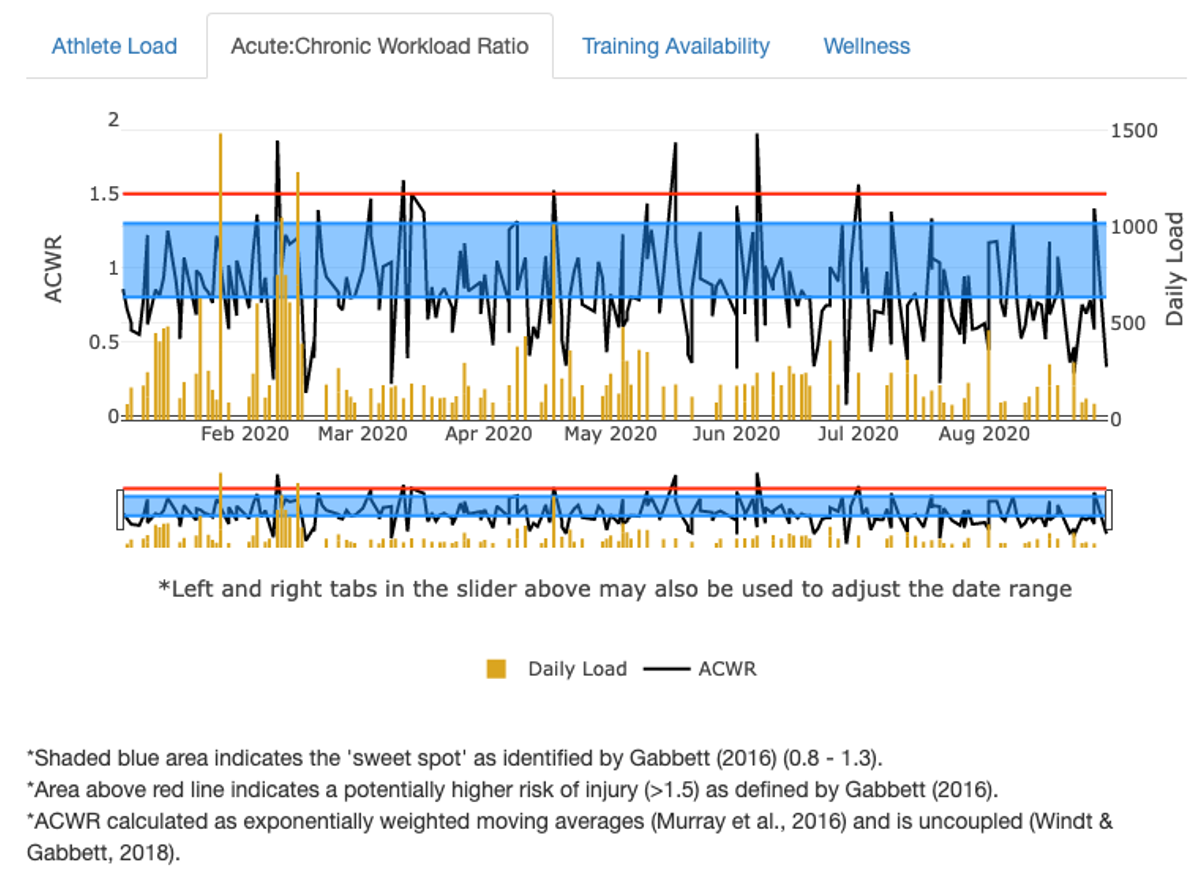
Above is one form of a questionnaire that is often used in sport and exercise that you might not have previously considered. Table 10.1 shows the modified RPE (rating of perceived exertion) scale. If you’ve every done any exercise testing, you’ve likely used some form of the RPE scale.[6] You simply ask your test subjects how difficult the activity was or currently is. They then point to a number to indicate such. The version you see on the above is the modified 1-10 version which is often used in practice as most people understand the range of 1-10 better than the original 6-20.[7] We can take this survey-based data and create some actionable information by converting it into a training load which is often used in sport science. One of the cheapest ways to calculate training load is via session based RPE measures (sRPE). They are easy to calculate as it is just the RPE * the activity duration in minutes. If we continuously collect this data, we can calculate some other training load-based statistics that may highlight certain areas of overuse injury risk, which is seen plotted on below.[8][9]
- Thomas, J., Nelson, J., Silverman, S. (2015) Research Methods in Physical Activity, 7th ed. Human Kinetics. Champaign, IL, USA. ↵
- Rea, L., Parker, R. (2014). Designing and Conducting Survey Research: A Comprehensive Guide. 4th Ed. Wiley, Bridgewater, NJ, USA. ↵
- Morrow, J., Mood, D., Disch, J., and Kang, M. (2016). Measurement and Evaluation in Human Performance. Human Kinetics. Champaign, IL. ↵
- Kreulen, J., Bailey, C. (2016). Academics, Athletics, Exercise, and Sleep in Collge Students. LaGrange College Undergraduate Research Conference, LaGrange, GA, USA. ↵
- Phillips, A. W., Reddy, S., & Durning, S. J. (2016). Improving response rates and evaluating nonresponse bias in surveys: AMEE Guide No. 102. Medical teacher, 38(3), 217–228. https://doi.org/10.3109/0142159X.2015.1105945 ↵
- Borg G. A. (1982). Psychophysical bases of perceived exertion. Medicine and science in sports and exercise, 14(5), 377–381. ↵
- Tibana, R. A., de Sousa, N., Cunha, G. V., Prestes, J., Fett, C., Gabbett, T. J., & Voltarelli, F. A. (2018). Validity of Session Rating Perceived Exertion Method for Quantifying Internal Training Load during High-Intensity Functional Training. Sports, 6(3), 68. https://doi.org/10.3390/sports6030068. ↵
- Gabbett TJ. The training-injury prevention paradox: should athletes be training smarter and harder? Br J Sports Med. 2016 Mar;50(5):273-80. doi: 10.1136/bjsports-2015-095788. Epub 2016 Jan 12. PMID: 26758673. ↵
- Murray NB, Gabbett TJ, Townshend AD, Blanch P. Calculating acute:chronic workload ratios using exponentially weighted moving averages provides a more sensitive indicator of injury likelihood than rolling averages. Br J Sports Med. 2017 May;51(9):749-754. doi: 10.1136/bjsports-2016-097152. ↵
