
11 Physical Fitness Testing
Chris Bailey, PhD, CSCS, RSCC
Over the next two chapters, many of the aspects previously discussed in this textbook will be brought together. Many real world examples have been discussed throughout this book, and this chapter will build on that examining some more of the applied aspects beginning with physical fitness testing. Some of what we discuss in this chapter will also apply to sport performance testing, but it will be discussed in further depth in the next chapter. No matter what profession you go into, you will likely be benefited by the ability to provide data supporting your decisions or recommendations based on tests you administer. In order to make decisions and implement data-driven solutions, we need to collect data first. There are many options for collecting physical fitness data and we will examine many of those in this chapter.
Chapter Learning Objectives
- Understand the justification for different tests and the data collection process
-
Differentiate between field and lab-based testing methods and the advantages or disadvantages of each
-
Examine different examples of many common tests
-
Recognize the usage of many of the techniques previously discussed in this textbook
Physical Fitness Testing
Physical fitness and fitness testing may be operational terms whose meaning changes based on the purpose of the test or the population that the data is being generalized to. The chosen test must be tied to the specific purpose, but some tests may be better suited for different populations. Consider an example where you are collecting data on the strength level of seniors. What would be the most appropriate way to measure strength? Grip strength dynamometer or 1RM deadlift? While there may be a few seniors who regularly strength train, that likely isn’t the norm. You will most likely be working with many that have very little experience. As a result, handing them a grip strength dynamometer and telling them to squeeze it as hard as they can may be the best option. What if the population were changed so that you would be working with a tactical profession like fire fighters? Now, the deadlift is likely a better option.
In terms of purpose, we might be interested in specific areas of health and fitness. Here are 3 common ones, the benefits of being physically fit in each, and some examples of ways we might test each. Keep in mind that many of the health-related benefits are associated with being physically active and not necessarily being physically fit. They are often intertwined as physically fit people are generally also going to be physically active. But you don’t have to be perfectly fit in order to receive the health-related benefits. Thus, from a health-related perspective, it is important to encourage increasing physical activity as that is generally a much easier hurdle to achieve than becoming physically fit.[1][2]
| Characteristic | Benefit Examples | Test Examples |
|---|---|---|
| Cardiovascular Fitness |
•Reduced risk of CV disease
•Reduced risk of mortality associated with CV disease
•Reduces risk of many forms of Cancer
|
•Graded exercise test (treadmill or bike)
•Step test
•Timed run/walk test
•Oxygen consumption (VO2) test
|
| Muscular Strength |
•Increased ability to perform ADLs
•Increased bone density
•Decreased loss of muscle mass with aging
•Reduced risk of metabolic syndrome & type II diabetes
•Reduced low back pain and injury incidence
|
•1RM, 3RM, 5RM, or predicted 1RM test
•Hand grip dynamometer
|
| Body Composition |
•Reduced risk of CV disease
•Reduced risk of metabolic syndrome & type II diabetes
•Reduced risk of osteoporosis (if bone density is included)
|
•DXA scan
•hydrostatic weighing
•bioelectrical impedance analysis (BIA)
•Skinfolds
•BMI
|
Once the purpose and the population we wish to generalize our results to is determined, it is time to select the test or tests. Generally, a test should be selected that has already been proven to be reliable and valid. That being said, many of the validation and reliability studies were likely performed on a population that is different than the one you are hoping to work with, so you should also evaluate the test-retest reliability if possible. The best way to increase your reliability is to standardize your methods and make sure you always do things the exact same way. Do them in the same order, with same intensity, and if your test involves any verbal cues make sure you give the same ones to all subjects. Pilot testing is a great way to make sure a protocol will work efficiently or to see where it can be improved. In terms of test-retest reliability, it may not be realistic to ask all of your subjects to repeat the test depending on what it is. Imagine completing a VO2max test and being told “Great Job! Let’s do it again.” You likely could convince a smaller number of people to do that though and this can often be done in conjunction with a pilot test.
One very important question to be considered is whether or not it is safe to test your volunteers and subjects. Depending on the population, you may or may not want to seek medical permission prior to physical fitness testing. If you are working with young and presumably healthy individuals, this may not be a concern. If you are working with seniors, where it is more likely that a large portion of your sample may be taking cardiovascular related medications and have health-related issues, this becomes more important. Rather than you making this decision, you should likely use some form of a readiness questionnaire. The most popular version is the PAR-Q or physical activity readiness questionnaire. It is short, only 7 questions, and very easy to interpret. If your volunteers answer ”no” to all items, they can participate. If they answer “yes” to any item, they should get a medical recommendation first.
| Yes | No | Question |
|---|---|---|
| Has your doctor ever said that you have a heart condition and that you should only do physical activity recommended by a doctor? | ||
| Do you feel pain in your chest when you do physical activity? | ||
| In the past month, have you had chest pain when you were not doing physical activity? | ||
| Do you lose your balance because of dizziness or do you ever lose consciousness? | ||
| Do you have a bone or joint problem (for example, back, knee or hip) that could be made worse by a change in your physical activity? | ||
| Is your doctor currently prescribing drugs (for example, water pills) for your blood pressure or heart condition? | ||
| Do you know of any other reason why you should not do physical activity? |
Laboratory and Field Testing
The main difference between lab and field-based testing methods is pretty self explanatory, one happens in a lab, and the other takes place wherever the population resides. Both can be used in research, but there definitely has traditionally been a stigma that lab collected data is better and field-based methods are more often used in performance testing where research may not be the focus. Historically, there has been some truth to this notion, but these lines have been blurred a little with the rise in technology and shrinking size of many pieces of equipment. Some traditional lab-based equipment has become more portable and may be adopted into filed-based environments, making us re-envision what a research lab actually is.
There are advantages and disadvantages to both lab- and field-based testing methods. From a purely quantitative and statistical approach, lab testing methods are always going to be more valid and reliable as far as the equipment goes. So lab testing methods are often the favored option for research, but it isn’t as straightforward as you might think.
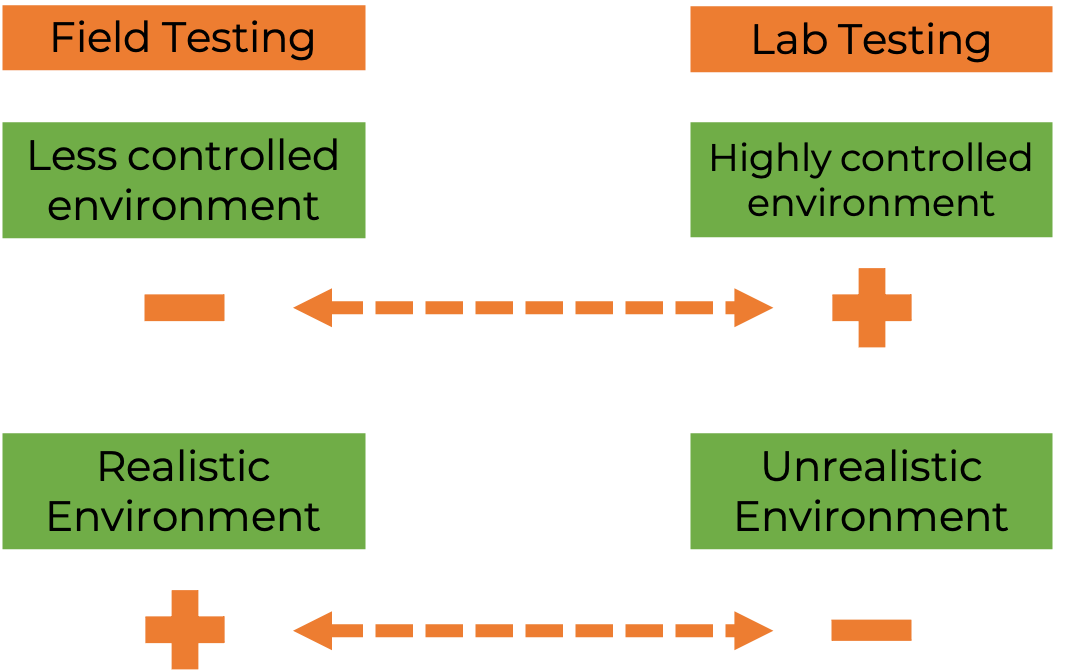
Two of the main arguments for or against each appear above in Figure 11.1.. Laboratory testing has the benefit of being able to strictly control nearly all aspects of the environment. When we are seeking to answer a specific research question, we generally have one variable that will manipulated (the independent variable), one variable is being measured to see how independent variable changes may result in other changes (the dependent variable), and all other variables are held constant or removed. This is done so that we can be certain of how changes in one variable are reflected in another. Allowing other variables to fluctuate in the study will complicate our results and interpretation. This is a big plus for lab testing. You won’t have to deal with any temperature or other weather changes that could take place outside. Distractions such as other people in a testing environment can be limited or removed. Field testing must deal with this issue and it may complicate results. If testing is happening outdoors, you should make sure all variables are constant between testing sessions. But what if you are looking for change year-round in some test. Temperatures in January are very different from temperatures in August and there isn’t much you can do about that. The error that this introduces must be acknowledged and considered in the interpretation. Even when using a field-based test indoors, there are environmental factors that we often cannot control. So, this is a disadvantage for field-based testing.
One big advantage of field testing is that it often has very strong ecological validity. Ecological validity refers to how realistic and similar the test and test scenario are to a specific real life situation. Consider an example where we are performing a biomechanical analysis of the movements of workers at a large warehouse. Using field-based data collection methods that are minimally invasive the worker might be able to continue doing their normal job while data is being collected. If we are using video-based analysis or wearable inertial sensors, the worker can perform their normal duties and may not even realize data is being collected. Consider a lab-based approach for the same example. Now we have the worker come into the lab and we have a similar, but not identical setup to their workstation. We now have them wear several retro-reflective markers and very tight-fitting clothing so that we can track their movement with infrared cameras positioned in a custom rig mounted around the room. While we try to recreate the actual work environment in the lab, it is often very different due to the controls we put into place. A research lab may also be intimidating to some individuals, so their data may not be the most accurate representation of their normal movements. As you can see this is an argument in favor of field testing and against lab testing.
| Item | Lab Testing | Field Testing |
|---|---|---|
| Environmental control | + | - |
| Ecological validity | - | + |
| Participant comfort | - | + |
| Electrical outlets | + | ? |
| Control of distractions | + | - ? + |
| Minimally invasive | - ? | + |
| Time | - | + ? |
| Participant interest in project | ? | + ? |
Table 11.3 shows a non-exhaustive list of potential advantages and disadvantages. It is important to note that these are not necessarily continuums like you see above. A pro for one is not always going to be a con for the other. Environmental control and ecological validity have already been discussed above. Field testing keeps the participants in their regular environment. Which means they will likely be more comfortable in that environment. This often results in a “truer” performance. This could be an advantage of field testing and could potentially be a disadvantage of lab testing. Of course, this really depends on what is being tested in the lab.
One advantage of lab testing is that you won’t have to worry about charging batteries and devices as you will likely have electrical outlets nearby. If you are conducting field tests in an electronic device and the battery dies, you are essentially done collecting data unless you have a backup battery.
As mentioned previously, lab testing has a major advantage in variable control. Field testing does not have this advantage. Depending on what is being tested, this could be viewed as a disadvantage or an advantage. Consider a strength test where others being tested are watching and cheering on participants. This encouragement may help participants perform, but how should this be viewed? It would be difficult to standardize the amount of encouragement given, so how can we control that? Considered this way, it seems like a disadvantage that we do not want. But, if this test was in an athlete population, their real environment will often includes cheering and encouragement, so this would be increasing ecological validity. Competition between participants can be another distraction that could be viewed as both an advantage or disadvantage. So, you would have to consider this carefully depending on the context of each situation.
Another potential advantage of field testing is that it can often be minimally invasive. The less the participant realizes they are being studied, the more likely they are to perform as they normally would. The opposite is often true in lab testing, so we must try to make participants as comfortable as possible. This is highly dependent on the type of data collection equipment used. A lot of external equipment has decreased in size and weight, so this may not be as big of a disadvantage anymore.
Time being taken away from participants normal schedule can be a big deterrent as far as research participation goes. Field testing can often be done very quickly or sometimes concurrently during normal routines. Consider sprint testing of athletes. Athletes in many sports will run sprints for conditioning and in sports like baseball or softball, they may run bases during practice as part of skill development. As such, one could set up sprint testing to coincide with either of those events. But, you should collect data early on in the session as fatigue might alter results later, especially if this is from a conditioning session.
Finally, having participants be interested in the project is beneficial in at least two ways. First, it will help with subject recruitment. Second, participants that are truly interested in the results may perform better on some tests than those that are more apathetic. Whether or not this is an advantage or disadvantage for lab testing is highly context-specific. Some studies will provide an incentive for participants, which will be the reason why they participate, but others may participate because they are truly interested. With field testing, especially in performance-based testing, most participants are highly interested in their own data. They want to know if they are getting better.
Physical Fitness Testing Categories and Examples
Below, several examples of testing for physical fitness will be discussed in three categories: cardiovascular fitness, muscular strength, and body composition. These are some of the most common categories and you should start to see how some of the quantitative procedures discussed previously are used along with them.
Cardiovascular Fitness
When discussing cardiovascular fitness, we are often talking about aerobic power, or the ability of our cardiovascular system to provide oxygenated blood to our working muscles.1 We have both lab and field methods to evaluate this. The lab methods are going to be the most reliable and valid methods for the same reasons discussed earlier. In fact, some of the field-based methods use regression or prediction equations built from lab-based studies, as we will see demonstrated below. In the lab, oxygen consumed will often be measured indirectly via gas calorimetry. The gas concentrations of the laboratory are either known or measured, and then a metabolic cart will measure the gases expelled during ventilation. The difference in oxygen content in the room and what is expelled is therefore what is used during the exercise. These tests can be maximal effort tests to derive a VO2max, or usually a VO2peak, or can be submaximal effort tests that later predict VO2max.
Lab-based methods
-
Measuring O2 consumed (gas calorimetry) during different types of endurance exercise
-
Maximal test (VO2max or VO2peak)
-
Submaximal test (estimates VO2max)
-
You might be wondering, if these are the most reliable and valid methods? Why would anyone ever use another method? Some of the main reasons are the cost of the equipment, the time it takes to measure, and the difficulty in performing the test. This establishes the opportunity for field-based methods. There are several options to choose from and they are not all listed below.
Field-based methods
- Step test
- Distance run
- Rockport 1-Mile Walk Test
- Non-exercise methods of predicting VO2max
Let's take a more in depth look at using a non-exercise method of predicting VO2max. Similar to other regression equations we’ve seen, they need predictor variables. There are many non-exercise prediction equations, but we will only discuss one for brevity. Matthews and colleagues provide a prediction equation that requires age, sex, height, body mass, percent body fat, and activity level.[4]
[asciimath]VO_2max=(0.133*"age")-(0.005*"age"^2)+(11.403*sex)+(1.463*"PA-R")+(9.17*height)-(0.254*mass)+34.142[/asciimath]
Where sex = 0 for females and 1 for males, PA-R is the physical activity rating from Jackson et al. 1990,[5] height is measured in meters, and body mass is measured in kilograms.
The equation was created by testing nearly 800 subjects in the age range of 20 to 79. If you remember back to the Chapter 3, a large sample should be expected based on the number of predictor variables included in the equation. The equation was created by using these variables to predict an actual measured VO2max value. The R2 value is quite good at 0.74. Take another look at the equation. Recall that regression equations utilize predictor variables and multiply them by coefficients. Can you spot each variable and their coefficients? Based on the value of each coefficient they are being multiplied by, can you guess which variable has the most predictive value in the equation? Sex has the largest coefficient, but it’s actually a little more complicated. Males are coded as 1 and females as 0, so if this equation is for a male, we are essentially adding 11.403 and if it is for a female, we are not adding anything. This is one of the criticisms of this equitation and likely why there are now many separate prediction equations for male and female populations. Age also appears to be important since it is included in the equation 2 times. You should also notice the constant value of 34.152 or what may also be called the y intercept. Hopefully this has demystified prediction equations somewhat, even when a lot of variables are included.
Muscular Strength
Strength can be defined as the ability to produce force at a given velocity.[6] As we’ve observed previously, there are benefits across all populations when strength is increased. Therefore, it is important to quantify. People often think of strength as a single value, such as a peak value of an amount of weight that can be lifted, but this is an extremely basic level understanding of strength. The forces we produce change over time throughout any movement due to many factors such as mechanical advantage. You likely know this if you lift weights because certain parts of the lift seem much more difficult than others. Understanding how forces and torques are produced throughout the movement paints a much more detailed picture of strength characteristics. Along with a peak value, the rate at which a force is developed may also be of interest. There are many times, especially in sports, where the rate of force development is more important than the maximum amount of force produced.
Lab strength tests are particularly good at measuring these types of variables. There are many forms of these tests, but all will utilize some form of electronic device to collect data. Some are capable of controlling variables such as speed (isokinetic) or force (isotonic) and others keep the position the same (isometric). These are all useful but may not be realistic as far as real-life movements go. For example, we never produce the same speed throughout a movement, so isokinetic devices are limited in ecological validity. A common piece of lab equipment that many different tests can be performed on is a force plate. It measures force and time, and many other variables can be calculated from that. Accelerometers and inertial measurement units (IMUs) help us by measuring position-based changes with time. These are dropping in price and are fairly portable, so they might be used with field tests as well.
Concerning field tests, a grip strength test is probably the easiest test to administer and doesn’t have any prerequisite exercise knowledge or experience. It isn’t perfect by any means, but it works because people who are strong enough to lift or move heavy objects generally have to be able to hold on to those objects. These tests are also very quick, so they may be the “go to” choice for a broad range of populations. Repetition maximum tests of specific exercises are usually much better options, but they can’t be applied to everyone the same way. For example, a 1 RM back squat test is a great measure of overall strength. But could you administer the test in an untrained population? If someone doesn’t have experience with a particular lift, their poor technique could result in an injury if they are performing it with maximal effort. So, individuals must have a prerequisite amount of experience before the test can be done and the test’s validity will increase as lifters' experience increases. Repetition maximum tests are the best field test of strength in athletes and physically fit populations when adequate experience is present. You can also use submaximal repetition maximum tests to predict 1RM values.
Lab-based methods
- Isokinetic devices
- Isometric tests
- Force plates
- Accelerometers and inertial sensors
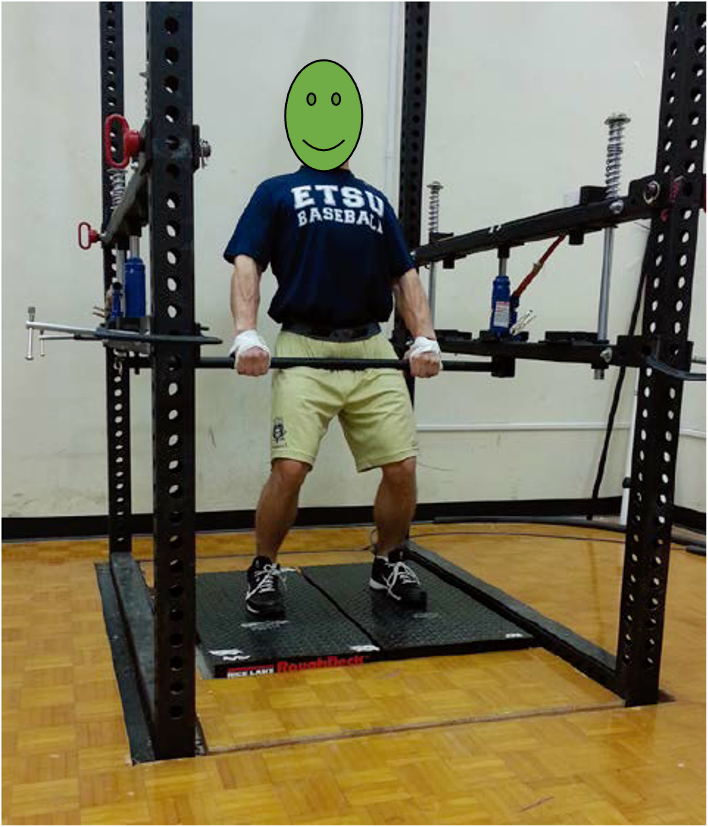
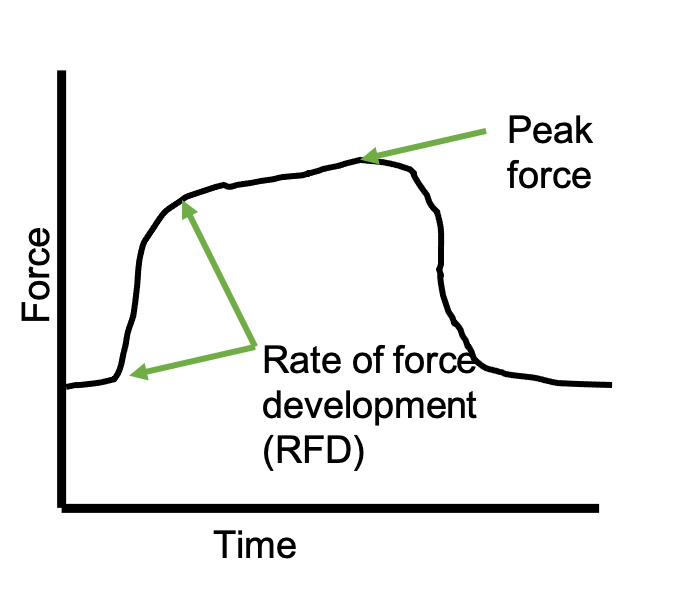
Figure 11.2 shows an example of an isometric test. This athlete is pulling on an immovable bar while standing on 2 adjacent force plates. The harder he pulls, the more force he puts into the ground and therefore into the force plates he is standing on. There are many variables that can be measured from a test performed on force plates, but only a couple will be highlighted for brevity. Peak force is simply the highest value produced and this can be seen in force-time curve in Figure 11.3 below. The rate of force development is the slope of the line between 2 set points. The steeper the slope, the quicker force is developed. Depending on the task or sport, one or both of these may be important.
Another benefit of a lab test like this over a traditional 1-repetition maximum (1RM) strength test is that a value is always produced. As we’ll see with 1RM testing, it is possible that a subject could miss a lift and then be too fatigued to produce a valid value.
Field-based methods
- Repetition maximum testing
- Grip strength dynamometer
- Accelerometers and inertial sensors
Figure 11.4 demonstrages a basic 1RM protocol. There are many different protocols, but all should include an adequate warm-up and small incremental increases in weight after each successful lift. While there are many protocols to choose from, once one is selected, it should be standardized and consistently used so that reliability does not suffer.
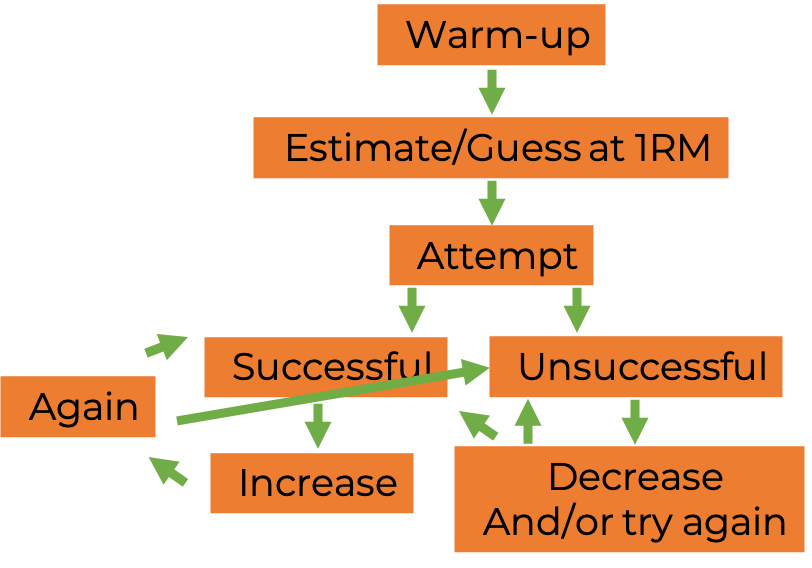
As you follow through the protocol shown in Figure 11.4, it is strongly desired that individuals have a very realistic guess or estimate of what their actual 1RM value will be. Whether or not they are successful at the eventual attempt, the attempt itself will cause some fatigue which will influence subsequent attempts. So, if they under- or overestimate the load, they will have wasted some amount of effort decreasing the validity of the measure. The more often they do this, the worse it will be. For this reason, many often choose to use 1RM prediction equations from submaximal loads lifted a few times (an example is shown below). The worst case scenario in a 1RM test is that the athlete misses the first attempt and several subsequent attempts resulting in too much fatigue to complete a lift. If they don't complete a lift, there is no data.
[asciimath]1RM=(0.033*"reps completed"*load)+load[/asciimath][7]
Body Composition
Since obesity has been connected to many negative health outcomes, it makes sense that it should be quantified. While many would like to use a simple measurement like body mass index (BMI) to evaluate this, it has some drawbacks. To be clear, BMI should be the method of choice when working with a large population as only 2 variables are required (height and weight) and can be calculated quickly. That being said, it does not quantify body composition because it does not really explain anything about the tissues that are included in body weight. Obesity specifically refers to excess body fat, whereas being overweight can happen any time the body's weight is above what is recommended for a given height. Weight can come from a number of different tissues, not just adipose. There are many people who are quite lean but are considered overweight because of muscle mass. When possible, body composition should be measured because it gives a much more in-depth picture of our tissue make up. Explaining body composition measurement is not the goal of this textbook, but it will highlight some parts of it here because it uses some of the statistical techniques previously discussed.
Lab-based methods
- DXA
- Hydrostatic (underwater) weighing
- Air displacement plethysmography (BodPod)
- Bioelectric impedance analysis (BIA)
- Isotopic dilution
Field-based methods
- Skinfold measurement
- Bioelectric impedance analysis (BIA)
Dual energy x-ray absorptiometry (DXA) and hydrostatic (underwater weighing) are the most valid options, but they are also very expensive. They are great for research, but you won’t see many of these in gyms, fitness centers, or health clubs. You will most likely see skinfold calipers used there. One type of device that is being used more and more is bioelectric impedance analysis or BIA. These can range greatly in price, and you get what you pay for in terms of reliability. There are many scales that now have BIA integrated into them. These often aren’t as valid as most of our other lab tests, but they are often reliable. This means that they might still be used to track changes over time because they will at least show the trend direction even if the precision of the value cannot be trusted.
One thing that is often misunderstood about most of these devices is that they don’t actually measure percent body fat. Most actually measure body density and then predict percent body fat from that. This is possible because there is a difference in tissue density between adipose and non-adipose tissue.
Let’s take a quick look at how this works in an example from underwater weighing. Based on Archimedes’ Principle, we can calculate body density. In order to do this, we must determine the dry weight or weight on land, the weight under water, the density of water, and the residual air volume of the lungs. Once we calculate or measure all of those, we can calculate the body density.
[asciimath]D_b=W_d/(((W_d-W_w)/D_w)-(RV+100"cc"))[/asciimath]
Where Db = body density, Wd = dry weight in kg, Ww = water weight in kg, Dw = density of water (≈0.997), and RV = residual air volume.[8]
From there, we can use either the Siri or Brozek formulas to predict % body fat. While they are set up a little different, they are still regression-based techniques. Multiplying by 100 simply turns the proportions into a percentage.
[asciimath]"Siri (1961) % fat" =[(4.95/D_b)-4.500]*100[/asciimath][9]
[asciimath]"Brozek et al. (1963) % fat" = [(4.57/D_b)-4.142]*100[/asciimath][10]
One final note here is that you will often need to clarify for your population tested that the results produced from body composition testing can reveal the amount of body fat and lean mass. They do not reveal the amount of muscle mass. For example, people often think that if they are 15% body fat, they must be 85% muscle, but they are forgetting about their bones, organs, connective tissue, etc. Some devices (i.e. DXA) can separate out bone mass and give more precision.
Body Mass Index (BMI)
[asciimath]BMI=("weight (kg)")/("height (m)"^2)[/asciimath]
BMI will be addressed here again due to its ease of use. It can have some issues in what is often categorized as the “normal” or “healthy weight” range, but it is often valid in the obese range. You can see the values and their interpretation category in table 11.4. The data in Table 11.4 came form the CDC, but others may provide more categories in the obese range with different levels.[11]
| Category | From | To |
|---|---|---|
| Underweight | <18.5</td> | |
| Normal (healthy weight) | 18.5 | 25 |
| Overweight | 25 | 30 |
| Obese | >30 |
BMI is most commonly used in epidemiology research as researchers can collect large amounts of height and weight data and easily calculate this measure, often without ever seeing the individuals that were measured.
If someone wanted to change their BMI, what would be the best approach? Assuming you are working with an adult, they can’t really change their height, so weight should be targeted. Based on the equation, you may have noticed that taller individuals have an advantage here and it is exponential. It will be easier for a taller person to lose or gain weight and see greater changes in their BMI relative to shorter individuals since height is squared.
- Dumke, CL. (2018). Health-Related Physical Fitness Testing and Interpretation. In Riebe, D. (Ed). ACSM's Guidelines for Exercise Testing and Prescription. (66-110). Wolters Kluwer. Philadelphia, PA, USA. ↵
- Morrow, J., Mood, D., Disch, J., and Kang, M. (2016). Measurement and Evaluation in Human Performance. Human Kinetics. Champaign, IL. ↵
- Franklin, BA. (2018). Exercise Participation Health Screening. In Riebe, D. (Ed). ACSM's Guidelines for Exercise Testing and Prescription. (29-32). Wolters Kluwer. Philadelphia, PA, USA. ↵
- Matthews CE, Heil DP, Freedson PS, Pastides H. Classification of cardiorespiratory fitness without exercise testing. Med Sci Sports Exerc. 1999 Mar;31(3):486-93. doi: 10.1097/00005768-199903000-00019. ↵
- Jackson AS, Blair SN, Mahar MT, Wier LT, Ross RM, Stuteville JE. Prediction of functional aerobic capacity without exercise testing. Med Sci Sports Exerc. 1990 Dec;22(6):863-70. doi: 10.1249/00005768-199012000-00021. ↵
- Stone, MH, Stone, ME, Sands, WA. (2007). Principles and Practice of Resistance Training. Human Kinetics. Champaign, IL, USA. ↵
- Epley, B. (1985). Poundage Chart. Boyd Epley Workout. Lincoln, NE. Body Enterprises. ↵
- Wilmore, J. H. (1969). "The use of actual predicted and constant residual volumes in the assessment of body composition by underwater weighing". Med Sci Sports. 1: 87–90. doi:10.1249/00005768-196906000-00006 ↵
- Brozek J, Grande F, Anderson JT, Keys A (September 1963), "Densitometric Analysis of Body Composition: Revision of some Quantitative Assumptions", Ann. N. Y. Acad. Sci., 110: 113–40, doi:10.1111/j.1749-6632.1963.tb17079.x ↵
- Siri, SE (1961), "Body composition from fluid spaces and density: analysis of methods", in Brozek J, Henschel A (eds.), Techniques for measuring body composition, Washington, DC: National Academy of Sciences, National Research Council, pp. 223–34 ↵
- About Adult BMI. (n.d.). CDC.Gov. Retrieved September 17, 2020, from https://www.cdc.gov/healthyweight/assessing/bmi/adult_bmi/index.html ↵
refers to how realistic and similar the test and test scenario are to a specific real life situation
