
12 Sport Performance Assessment
Chris Bailey, PhD, CSCS, RSCC

This chapter will serve as an introduction to many sport performance assessment methods, but you should also recognize many of the statistical tools that have been discussed before. The term preparedness will often be used instead of performance for many of the measures discussed in this chapter because preparedness represents the ability to perform, and performance is generally the actual performance that occurs. For example, a vertical jump test may often be described as a sport performance test, but it may also be called a test of preparedness for that athlete’s sport. If that athlete is a volleyball player, the number of kills, blocks, or assists in a match would be the actual performance statistics.
Chapter Learning Objectives
- Understand the justification for assessing sport performance
- Explore the main quantitative tools in sport performance assessment
- Understand the importance of ecological validity in sport performance assessment
- Investigate the main areas of assessment within sport performance assessment
- Review best practices for measurement
Why assess sport performance (preparedness)?
There are many reasons why we should assess sport performance and preparedness. This chapter will discuss a few of the main justifications. While we have a pretty good idea of how the average person might respond to training, we shouldn’t assume that all athletes respond in the same way to the same stimuli whether it be a practice session, competition, or resistance training session. The data we get from assessment will provide direct feedback of the athlete’s development. This will also help us understand if we should alter anything in the athlete’s training program.[1] On the research side of things, assessing athlete performance may lead to discoveries of specific variables that contribute to optimal performance.[2] If we think there is a causal relationship between the variables, we might choose to focus our training on developing those. From a talent scouting perspective, we should focus our efforts in recruiting on those athletes that express optimal performance in those specific variables. If we are able to collect this data for a long time, we might be able to discover factors that are associated with injury, overtraining, and athlete burnout.[3][4] We could then avoid making some of those mistakes in the future. Unfortunately, some athletes will get injured at some point. Assessing their performance on specific tasks and drills will give us a better indication of when they are ready to return to play for their sport. Let's look a little more in depth on each of these reasons.
Understanding the Training Process
In terms of understanding the training process, we usually follow a modified version of the General Adaptation Syndrome from Hans Selye. Whenever we train, practice, or compete, we are providing a stimulus to our bodies that will result in some form of adaptation. But before that happens, we will be fatigued because of the stimulus. Eventually we will recover, but we may also over-adapt so that we are actually better off than we were before. So, we no have a new, and better, level of preparedness. This cycle is which was adapted and interpreted by Zatsiorsky (1995)[5] for training is depicted in Figure 12.1 below.
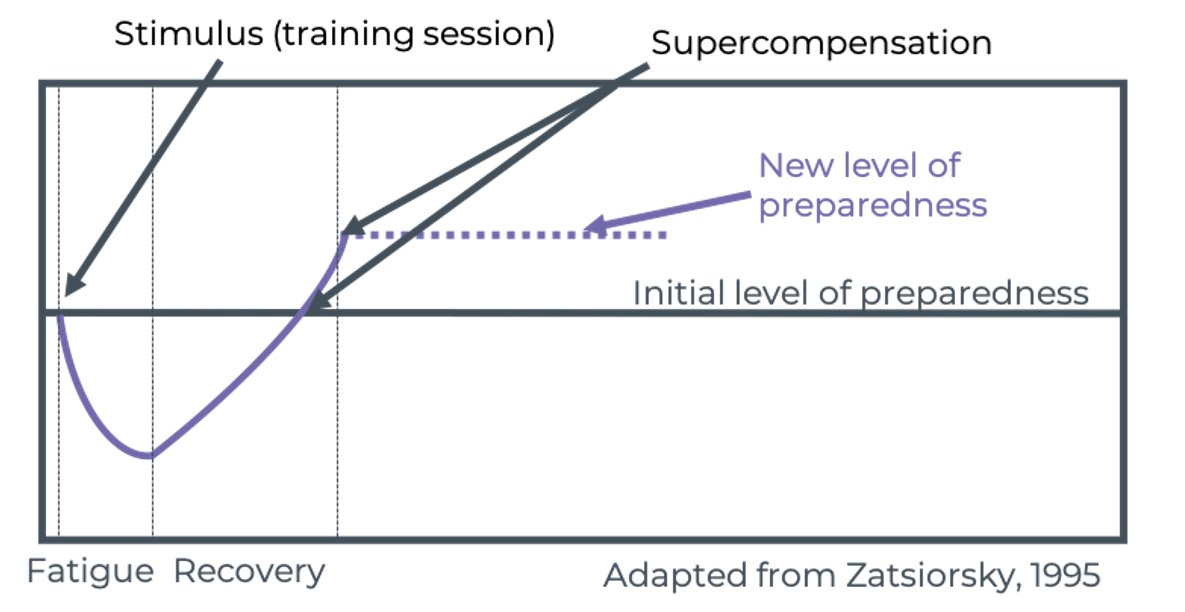
If we are collecting data on our athletes, we may be able to determine several points of this process including the stimulus size (or training load), recovery process, and new level of preparedness. We can then determine how well each athlete is adapting to specific training stimuli and if they should be altered in order to optimize training adaptations.
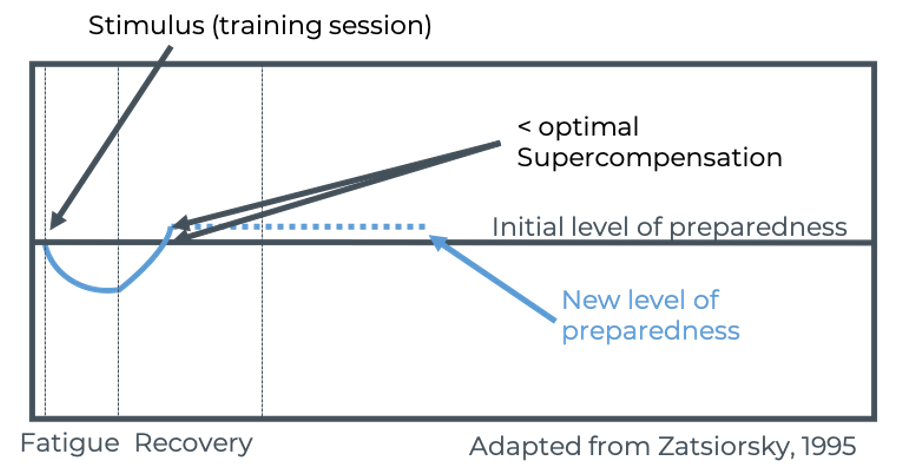
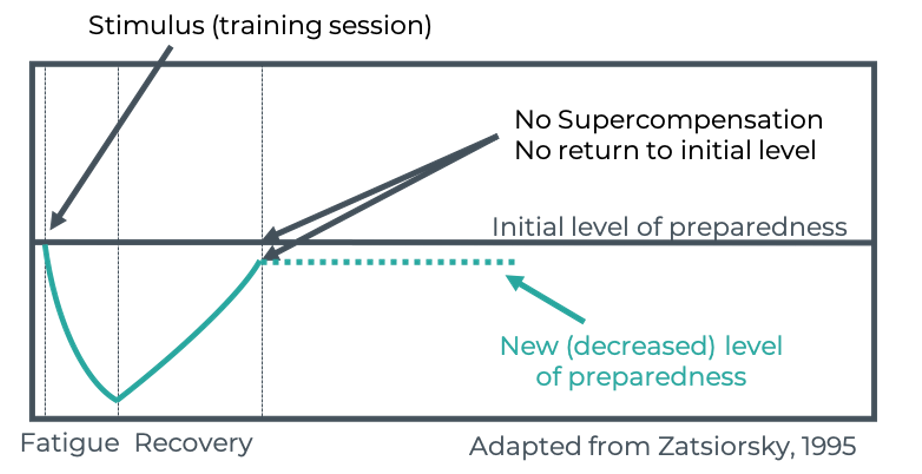
If we consider the example in Figure 12.1 the optimal training stimulus size, Figures 12.2 and 12.3 would be considered suboptimal. They include all of the same elements, but now incorporates a training stimulus that is too small in Figure 12.2 and too large in Figure 12.3. In Figure 12.2, the athlete recovers just fine, but the increase in preparedness isn’t very much. This would likely return to our normal baseline if it was not followed up with another training session sometime soon. In Figure 12.3, a larger stimulus was implemented, and the athlete does not fully recover from the training session in the same amount of time, so now they actually have a decreased level of preparedness. This may actually be by design, which is called planned overreaching, but some extra recovery time is planned later so that the desired adaptation can eventually be expressed. This also may have been done on accident if our athlete was not as fit as the coaches thought they were and they couldn’t handle the workload.
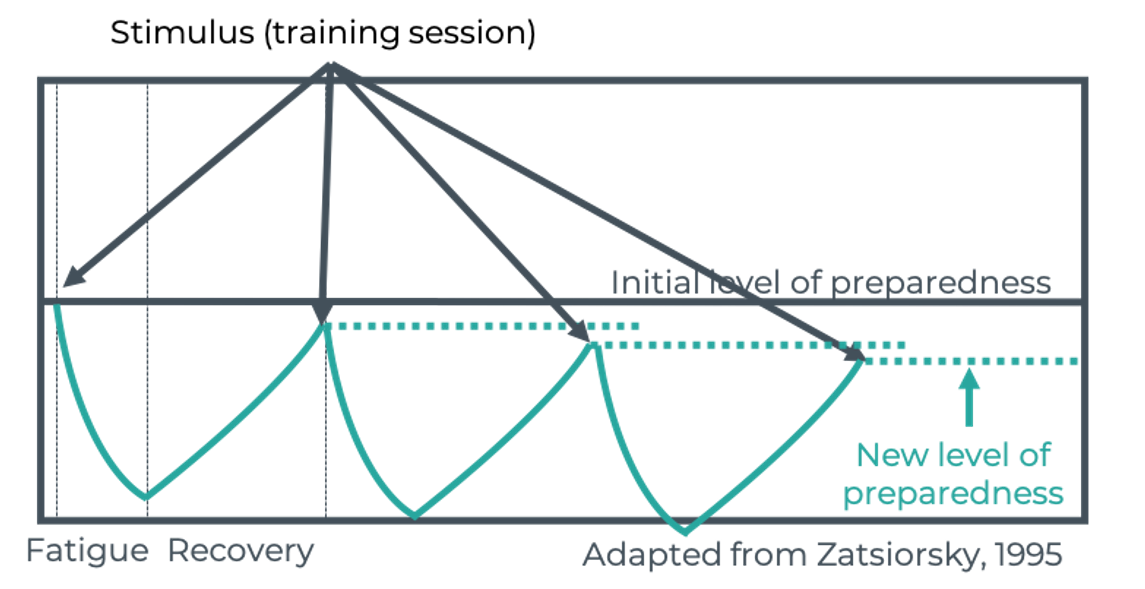
If we kept implementing a similar large training stimulus, we would see the athlete becoming more and more fatigued. Fatigue masks our ability to express our fitness levels, so their preparedness would keep decreasing until adequate recovery time was given. Figure 12.4 (below) depicts this as one form of training stimulus applied again and again, so you might be thinking why would a coach knowingly do this to an athlete? It is important to remember that these stimuli can take many forms. Competitions, practices, resistance training, and conditioning are all stimuli. Also, the ability to recover is impacted by several decisions that the athlete makes including sleep and nutrition. Other factors can also impact recovery including social lives and, if they are a student athlete, courses. As much as possible, coaches and practitioners need to consider all these types of stimuli to understand the process training, adaptation, and overall athlete development. Many of these factors can be measured and quantified, which should aid in athlete development.
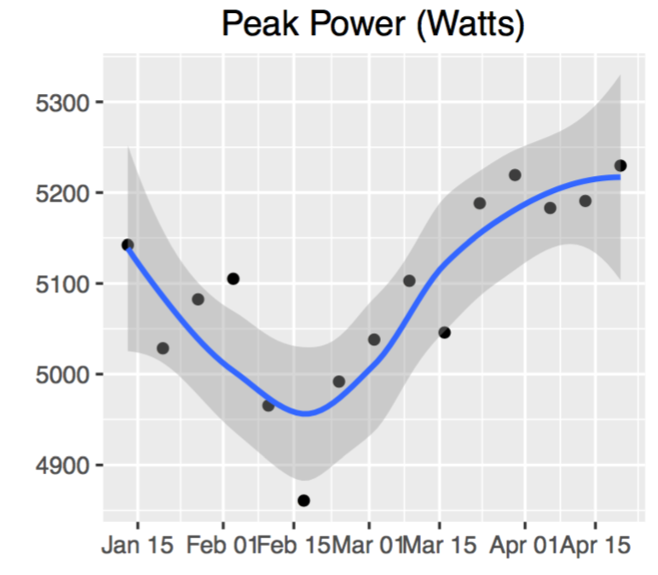
Providing Progress Feedback
Of course, if we don’t assess athletes, we won’t actually know how they are developing. We won’t have the feedback we discussed in the previous figures and we won’t know how well their training and development program is working. This data can validate that you are doing a good job with your athletes, but it could also show areas that need to be improved. This can be viewed as how an athlete changes relative to themselves as in the time series plot in Figure 12.5, or relative to the team average in the radar plot in Figure 12.6. Both may be of interest to coaches and practitioners.

Talent Identification and Key Performance Indicators
As mentioned previously, assessment may help us determine which variables may contribute to optimal performance.2 Table 12.1 demonstrates one example of finding variables that may be predictive of optimal performance in a sample of baseball players isometric strength characteristics and several measures of batting performance. Producing high forces and the ability to produce them quickly (RFD = rate of force development) appears to be strongly related to several offense power statistics. But it does not seem to be related to batting average in general, which seems to indicate that we might improve offensive performance if we can get our better hitters stronger, but it does not mean that we can make our players better hitters by getting stronger alone.[6]
| RFD | F@50 | F@90 | F@250 | |
|---|---|---|---|---|
| Ba Avg | .040 | -.346 | -.192 | -.073 |
| 2B | .464** | .144 | .302 | .347 |
| SLG | .603** | .405* | .516** | .539** |
| HRs | .633** | .489** | .573** | .577** |
Injury, Overtraining, and Athlete Burnout
In terms of injury, overtraining, and athlete burnout, there are a lot of sport scientists whose main priority is in this area. They often track athlete workloads, the rates that those workloads change, wellness factors, and many other variables in hopes of uncovering something that keeps athletes healthier. A considerable amount of research has been published in this area recently, but there is no single golden variable that serves as a predictor of injury. This is a multifaceted problem that is often individual specific. So, it takes time to develop processes, models, and recommendations in this area.[7][8][9][10]
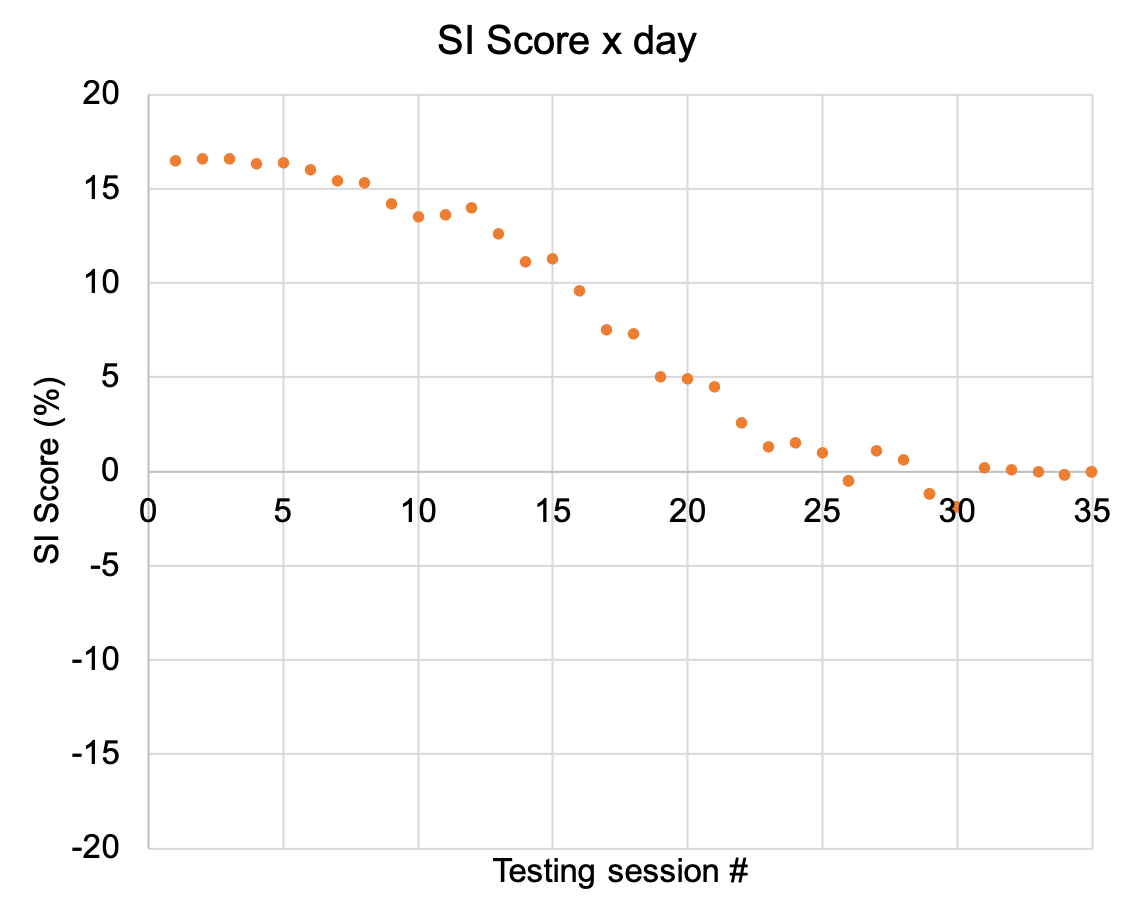
Information for Return to Play Protocols
There are many areas where data should be collected in regard to return-to-play protocols, and those are injury and sport-specific. One example of this comes from an ACL reconstruction case study.[11] There are many common range of motion, stability, and strength tests that one may undergo during rehab, but there aren’t many that combine all those into one objective test. Figure 12.7 demonstrates this with theoretical data of the peak propulsion forces applied during a vertical jump. The athlete stands with one foot on a separate force plate and then jumps. The SI or symmetry index score is a symmetry measure where 0 indicates perfect symmetry and values further away represent larger asymmetries. The negative or positive value indicates the asymmetry direction. As you can see here, the athlete was fairly asymmetrical early on, producing more force with the healthy side. But over time throughout the rehab process, he became more symmetrical, and may signal his readiness to resume playing.
Main Statistical Tools in Sport Performance Assessment
- Reliability
- Validity
- Correlation
- Linear and Nonlinear Modelling
- Means comparison
- Practical significance
- Time series
- Data visualization
These are some of the main statistical tools used in sport performance assessment. Pretty much any of the statistical tests discussed so far could also be used here, but these are probably the most commonly used. The reliability and validity of our data is very important in any environment, and that does not change because you may be using more field tests. Whenever you can, you should perform your own validity assessment. This may not always be possible because a device capable of being the criterion measure or “gold standard” is often expensive and many may not have access to one. But one can always evaluate their own test-retest reliability. As we learned earlier, you may find publications of the reliability of new equipment, but they often didn’t test it in a population similar to the one you are working with, so you cannot trust that the findings will be the same. As as result, you must evaluate your own reliability.
Correlation is a very common tool used in performance assessment. It was the main approach in the data shown earlier examining the relationship between strength and baseball hitting performance. Regression or linear and nonlinear modeling may also be used. Performance prediction is a very popular concept in sport performance science, but it isn’t used as often in the ways you might think. We may often use a linear regression equation to predict a variable that we cannot measure directly in a field test. For example, using body mass and jump height to predict vertical jumping peak power if we do not have a force plate another device capable of measuring it directly.
Means comparisons via many methods are also common. One issue in sports is that you are often working with smaller sample sizes, which decreases your chances of finding statistical significance or p values < 0.05. As a result, you may encounter a heavier reliance on effect sizes and practical significance, but both statistical and practical significance should be reported.
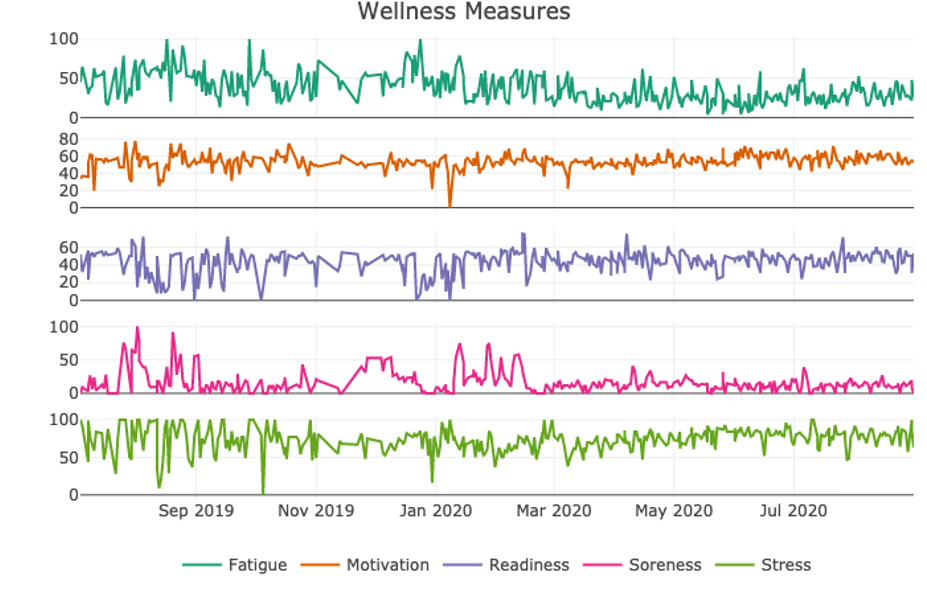
Finally, along with many forms of data visualization, the time series plot may be one of the most widely used methods when regular repeated measures are taken. In fact, most of the plots shown in this chapter have been some variation of a time series plot including the one in Figure 12.8. If you collect data on a regular basis, you can plot it on your y axis and time on the x axis in order to see changes in that variable with respect to time. Figure 12.8 demonstrates this with 5 different wellness measures stacked on top of each other. This method comes from the business world and a method called statistical process control. As you may have noticed on some of the previously shown time series plots, some shaded area appeared around the the data. These are called control limits and we may use those to signal that something is changing in a big way if some point of data appears outside of them. We can often go back to that point and time and take a look at some of the other factors to determine the cause of this change.
Ecological Validity
Ecological validity is a high priority in sport performance testing. If athletes do not perform as they normally would because they are not in a realistic scenario, the data won’t be worth collecting. We must design our testing environment so that athletes feel they are simply performing as they normally would. This often means that our testing should be minimally invasive. So, we won't be adding on a bunch of extra equipment that might restrict their movement or cause them to change their normal behavior. This also means that sport performance assessment will mostly utilize field testing methods.
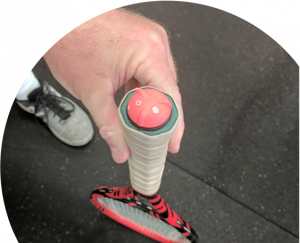
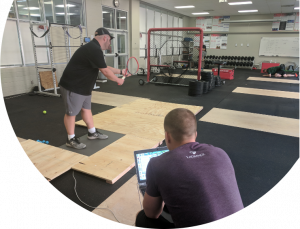
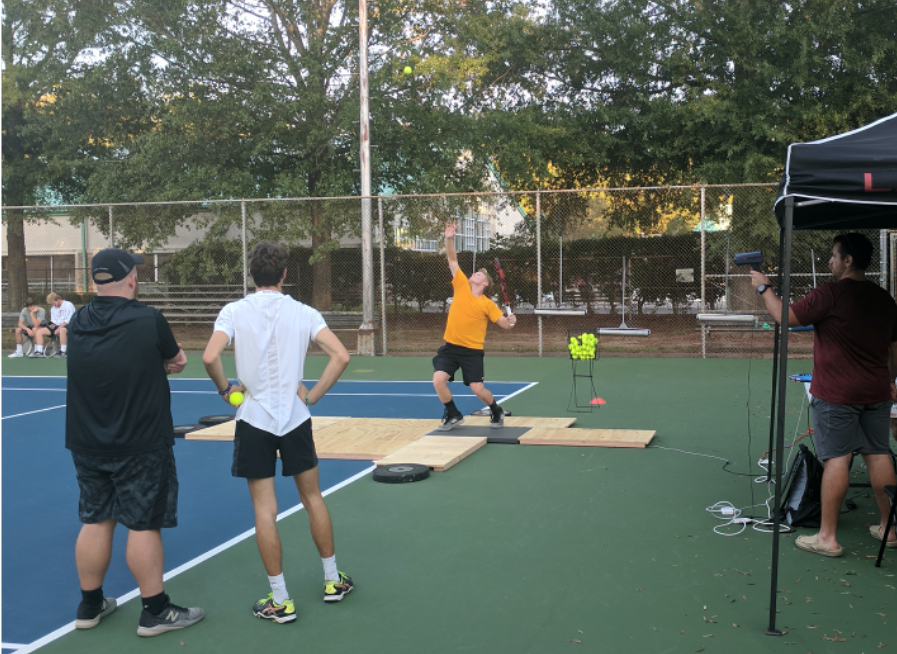
With consistent advances in technology, this is more possible than ever. Figure 12.9 shows an inertial measurement unit that has been attached to the bottom of a tennis racquet. Since it is so light, most athletes do not realize it is there. This device can measure changes in acceleration, velocity, position, and predict serve velocity. In the Figure 12.12 on the right, you can see some pilot study where a force plate is embedded in plywood so that athletes ground reaction forces can be measured during a tennis serve. A standard baseball screen was positioned in the area where the serve could be collected. All of this would work to collect data, but it might feel weird to a tennis player serving in a weight room/sport performance lab. Fortunately, all of the equipment is portable, so the entire setup could be placed on an actual tennis court. This undoubtedly makes the athletes more comfortable and adds to the validity of their data.
Common Areas of Sport Performance Assessment
There are many areas of sport that can be evaluated, and they should be selected based on the needs of that particular sport. The areas listed below are some of the most common, but there are more that might be important for a given sport.
- Strength
- Power
- Speed
- Change of Direction Ability (CODA)
- Agility
- Training Load
- Wellness
- Body Composition
- Flexibility, mobility, and stability
Strength
Strength can be assessed similarly to what was described previously, but there likely will be more of a field-based testing approach in sport performance. This means that 1RM or multiple RM, and 1RM prediction methods are more likely to be used. The 1RM is the most popular method, but it does have advantages and disadvantages that were discussed in Chapter 11. Reliability of our data is highly dependent on standardizing our methods, so this is imperative. Isometric strength testing is possible, but it will almost always be a multijoint test like a mid-thigh pull or a squat. Single joint tests are likely never done with athletes since they lack sport specificity. Along with that, it would be extremely rare to see an isokinetic test with athletes as it has minimal ecological validity. One common issue with strength testing, as well as any maximal effort test, is that it will be difficult to evaluate reliability in a test-retest format since the first trial will undoubtedly result in some fatigue that will influence subsequent trials. Evaluating within session test-retest reliability is still recommended, but it may not be possible in some scenarios.
1 RM Strength Estimates
While many will desire to know their “true” 1RM, a 1RM prediction is not a bad option for most scenarios. If you consider the protocol shown in chapter 11 for a 1RM test, how long do you think the test will last? Also, given that we might be interested in more than one exercise, you may want to multiply that time by 2 or 3. As you can imagine, doing 1RM testing may take up the entire lifting session. Going back to the philosophy of being minimally invasive, we could have the strength and conditioning program set up so that athletes warm up to a heavy set of 2 or 3 and then do 2 or 3 more sets to finish out their workout. When training for strength, it is common to utilize high loads with low volume. So a session using exercises with 3-5 sets of 2-3 reps is a common occurrence. What if we had the athletes warm up to the heaviest load they could lift for 2-3 times and used that amount in a prediction equation? This works and this allows them to finish out the session so that the whole session isn’t devoted to testing. But, what if they could only do 1 repetition? Then that is their 1RM. What if it was easy and they completed 4 or 5 reps instead of the prescribed 2-3? Then that number could be plugged into the prediction equation instead of 2 or 3. This negates the risk of missing out on data if lifts are missed as in a 1RM test. As long as at least one repetition is completed, the equation can be adjusted to correct for missed reps. This method also allows more frequent testing of strength during a high intensity training phases.
Strength Lab Tests
While it isn't used as often as repetition maximum testing, isometric strength testing is done in sport performance. It should likely be a multijoint exercise like the mid-thigh pull shown in Chapter 11, as that is more specific to most sports. The positioning of this test is set up to mimic the second pull position of a clean, but is also considered the "power" position in many sports. Similar to the submaximal repetition maximum prediction method, one big benefit of an isometric test over a traditional 1 repetition maximum strength test is that a value is always produced. You will never “miss” a lift. The downside is that the equipment can be expensive and may be a bit more time demanding on the athletes.
Grip Strength?
What about grip strength? Grip strength is not a recommended assessment with trained athletes. There is a correlation between grip strength and overall strength in the general population, but it’s a little more complicated when you are working with athletes. Once a certain level of strength is achieved, it’s likely that this correlation disappears. As you can see in Figure 12.12, the untrained population is weaker, but the slope of the trendline is positive and the correlation is strong. However, in the stronger and trained group, the slope has leveled out and the association is weaker.
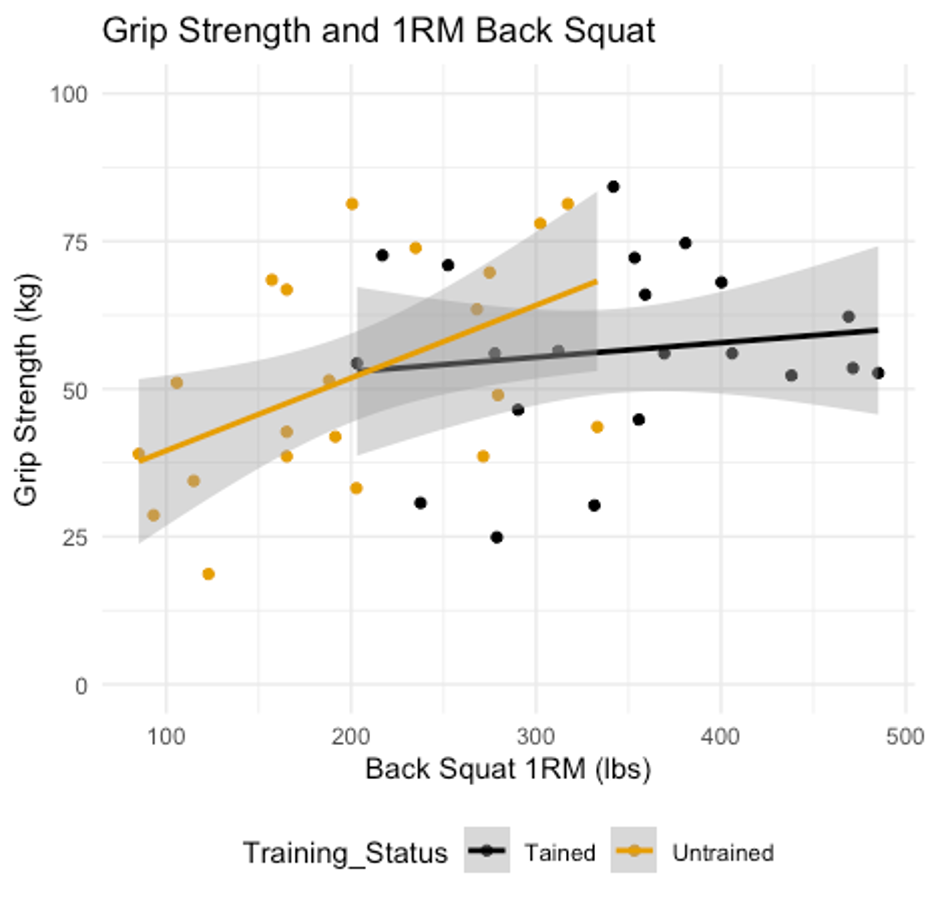
This could be due to the fact that the muscles in our legs are always going to be stronger than those in our forearms that help us grip. Because of this, at some point during training we will need to use lifting straps to keep increasing the strength of our leg musculature since our grip won’t be able to keep up. You could try to train your grip to hold heavier loads so that you could train your lower body with the heavier and unstrapped weight, but that would take much longer. This would mean that there is a point where grip won’t be as important after reaching a prerequisite amount of strength.
Power
Power is a work rate. Work is the amount of force we produce multiplied the amount we displace the object. So, we could say that power is work times displacement divided by time. If you’ve taken a biomechanics course, you should know where this is leading. Velocity is displacement divided by time. So, we could then say that power is equal to force times velocity.
[asciimath]Power=("work"*"displacement")/(time)[/asciimath]
[asciimath](displacement)/(time)=velocity[/asciimath]
so,
[asciimath]Power = "force"*"velocity"[/asciimath]
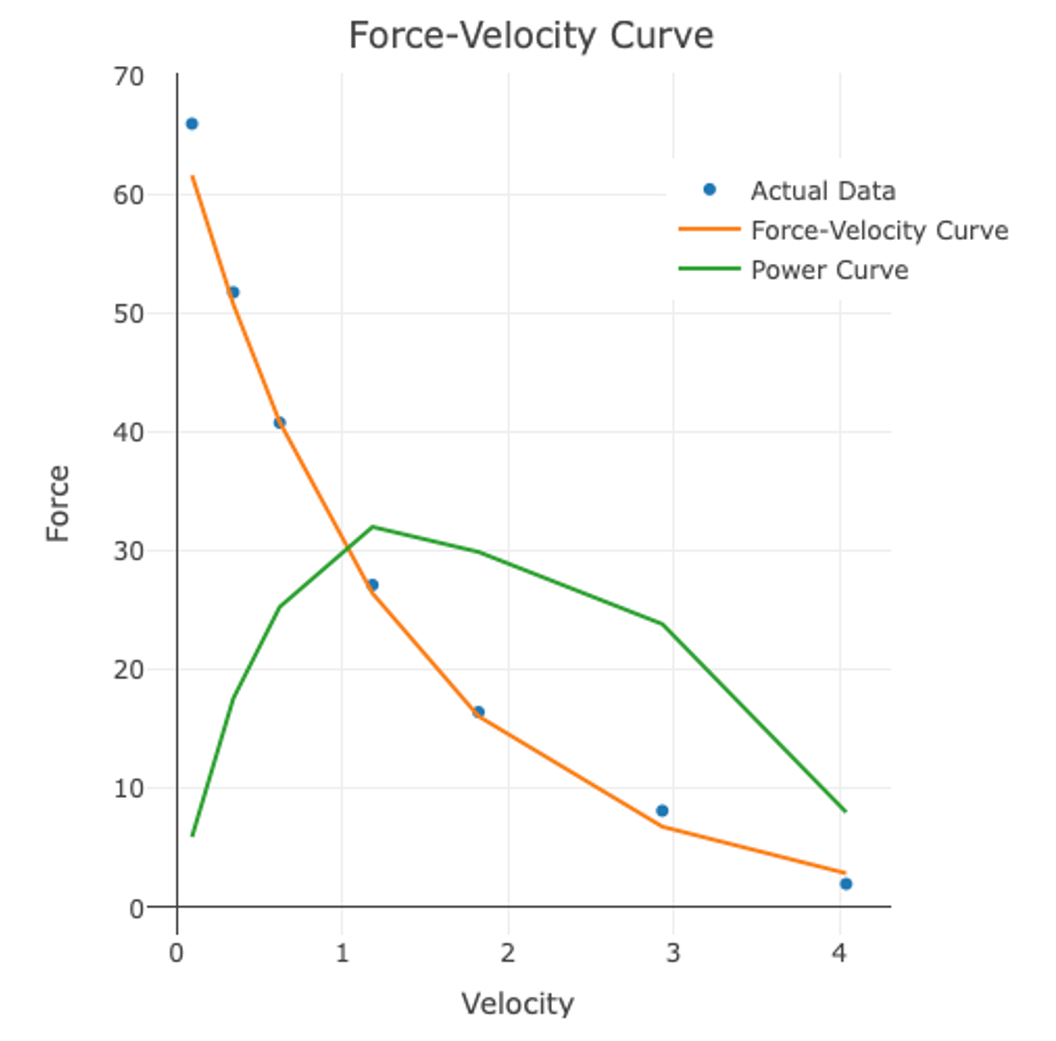
Any time we move an object (including our own body parts or our entire body), we produce force and velocity, so we produce power. Peak power will then be the optimal product or combination of force and velocity. This can be seen in Figure 12.13 that is a recreation of A.V. Hill's initial publication of the force-velocity curve using data digitized from it.[12] A power curve was added by multiplying the force and velocity data points together and is represented by the green curve. As can be observed, in this example peak power is not produced near the highest levels of force production nor is it produced at the highest levels of velocity. It is somewhere in the middle.
Measuring power directly requires equipment that may be expensive. Force plates will measure force directly and velocity can be calculated from it, but this is an expensive option that may not be available to everyone. Accelerometers measure acceleration, which can be integrated to produce velocity. Acceleration can be multiplied by mass to produce force, so power can then be calculated. Accelerometers range in price and these may be a good option for some as the data will often be automatically sent to your computer or tablet for analysis. The issue is that you may need to buy one for each athlete, which increases the price significantly.
The most affordable and most widely used method comes from only measuring jump height and then predicting peak power. This is possible due to the relationships between jump height, body mass, and peak power. In order to accomplish this, you need a scale and a device to measure jump height.
Jump and reach devices are probably the most common method and they cost roughly $500. The downside to these is that many don’t standardize their methods well, so reliability suffers. The problem step is most often in measuring the reach height prior to jumping. Athletes can alter their reach height by standing flat-footed, standing on their toes, retracting their shoulder, etc. The reach height is subtracted from the jump height, so some clever athletes may purposely make their reach heights smaller. Another downside is that this test takes more time than many of the other options. A switch mat is another, similarly priced, alternative and it is a very quick measurement. The athlete simply steps on the mat and jumps. The mat measures the flight time and predicts jump height from that . Similarly, methods must be standardized, or else reliability will suffer.
[asciimath]"Jump Height" = ("flight time"^2*9.81)/8[/asciimath]
Next, the data can be plugged into a peak power prediction equation. One of the most common ones comes from Sayers.[13]
[asciimath]"Peak Power (W)"=60.7 * "jump height (cm)" + 45.3 - "body mass (kg)" -2055[/asciimath]
This format should look familiar because it follows the basic y=b1x1 +b2x2 + c regression format discussed in Chapter 3. For each predictor variable there is a coefficient that it must be multiplied by and there is a constant value (-2055 in this case).
Speed
Speed can be measured in multiple ways. While many you work with may not know the difference, you should be clear about what variable you are actually measuring (speed, velocity, acceleration, or simply time). The simplest and most commonly used method is measuring out a known distance and timing the athlete sprinting from one side to the other. This can be reported as time (in seconds) or velocity if you divide the distance (or displacement) by the time. This is by far the cheapest method. It can be improved on if splits, or intervals, are added in allowing for further analysis of the sprint. You may then be able to get a time for their starting technique (often the first 10 m), acceleration phase (10-20 m), and ability to maintain velocity (20 m and beyond).
This can be accomplished with some stopwatches, but they aren't the best choice. One issue that hurts reliability of timing with stopwatches is that the athlete is not the only one being timed. The timer's reaction time is also included. In this situation, the reaction time is the time between the timer seeing the event and when they are able to click the button.
Infrared or photocell timing gates are a great option to avoid this issue. You may have heard of these before or heard someone incorrectly refer to them as a laser device. They are a bit more expensive, but they take the tester out of the equation along with their measurement error. Many of these also come with a starting button or block, so the time will start on the athlete’s movement instead of a manual start by pushing a button. You can create as many intervals as needed as long as you have the gates to do it. If velocities are calculated, average accelerations between each interval can also be calculated.
Velocity and acceleration can be measured more directly with GPS devices and accelerometers, but they are more expensive, and a device for each athlete will be needed rapidly increasing the cost. The benefit is that it can be measured during a practice or potentially a competition (if rules allow it) as opposed to setting up a testing session. This also makes it a truer performance measure as opposed to a readiness measure. You can get much more precision and depth to all measures with these types of devices. If your budget can support it, this is the best option.
Agility versus CODA
Change of direction ability (CODA) is often (incorrectly) referred to it as agility, but agility and CODA are different qualities. Agility is a whole-body change of direction in response to an external stimulus.[14] That last part is key, because agility requires decision making. COD is a pre-planned event. So, most of the traditional agility tests are actually CODA tests. For example, consider the pro-agility test (also called the 5-10-5) or the 3-cone drill. Both are a part of the NFL combine, and both are actually CODA. Another common misconception is the agility ladder, which requires neither agility nor CODA as most of the drills on it don’t require a whole-body change of direction.
CODA tests could be used to evaluate agility if some decision-making process is added to the protocol (Figure 12.14). Unfortunately, this often introduces error which decreases reliability. This error could happen because the athlete makes the wrong decision or they just take longer than normal to make the decision. Another source of error could be form the tester. If a manual signal to change direction is given by the tester, this will undoubtedly decrease reliability. Now you would be measuring the decision-making process of the athlete and the tester. There are directional devices that will randomly indicate when the athlete should change direction, and this will remove this part of the error.
COD Deficit
This should be taken a step further. CODA is strongly correlated with sprint ability in testing. PPM r values of 0.52 to 0.70 have been found between the 5-0-5 CODA test and the 10 m and 30 m sprint times and an r value of 0.89 between the pro agility test and 10 yd sprint test.[15][16] Using the coefficient of determination, we know that sprinting shares between 27 and 79 % of the variance with CODA, which can be a huge amount. Said another way, CODA tests may not tease out independent qualities from sprinting ability. But this should make some sense as sprinting is a part of all CODA tests. Another alternative is the COD deficit test which helps us assess a more independent quality. We must measure the 10 m sprint time, 5-0-5 COD time and then simply subtract the 10 m sprint time from the 5-0-5 time. The result restricts the actual COD from sprinting ability. This does require one extra test, but most would likely be doing a sprint test anyway, so it may not actually require any more time.

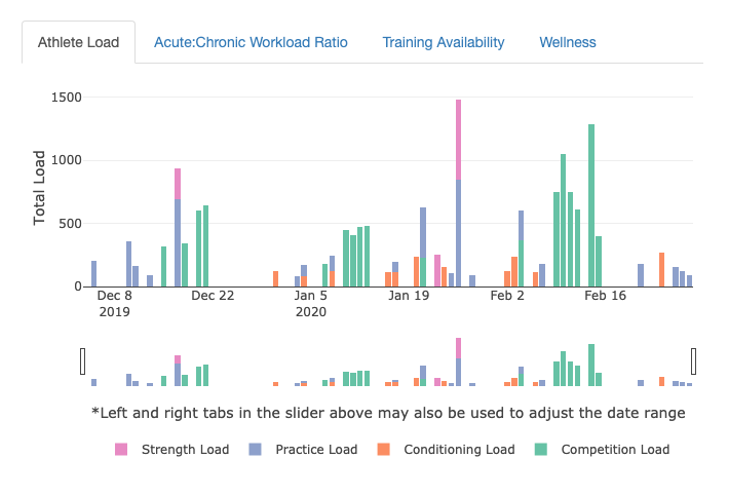
Training Load
Training load is meant to quantify the total intensity and duration of training in one metric for a given day, week, month, or some other set amount of time. Training load helps us understand how athletes are responding to training, competition, and other stresses. So, it will help us quantify or estimate athletes’ preparedness (their ability to perform). Some research uses training loads and the rates at which athletes change them to make connections to injury risk.
Session training load (sTL) is a metric specific to one session. It is quantified as the product of the session intensity and the session duration in minutes. It is not uncommon that athletes have multiple training sessions in a day, so the daily training load is the sum of all sTLs for the day.
[asciimath]sTL = "session intensity" * "session duration"[/asciimath]
[asciimath]TL_"daily" = sum"sTL"[/asciimath]
External and Internal Measures
Training load is often broken down into 2 categories: external load measures and internal load measures. External load measures are usually some form of a performance variable.[17] For example, in a resistance a training session we might calculate volume load (which is the sets * reps * weight lifted for reach exercise). This is performance based and is an external load measure. Another example would be GPS derived distance ran or time spent running at specific velocity ranges in a game or practice. Internal load measures are generally internal responses to training or other stimuli. They can be objective, like heart rate or HRV, or they can be subjective like RPE or wellness measures. Athlete preparedness and external load measures are related to internal load measures, but it is complicated as both physiological measures and psychological measures impact internal loads.
RPE Training Load Measures
RPE-based training load measures are likely the most common because they are largely free. Another benefit of the RPE method is that it works across different session types.[18] For example, using volume load is a great way to quantify load in a resistance training session, but it would be hard to combine that with a competition based load measure in a basketball player as the units of measure are likely very different. They can be created by producing a 1-item questionnaire and administering it to athletes. The one item should ask something to the effect of, “How would you rate this session?”. The responses should be inputted be via a scale, which is generally 1-10 or 1-100 and their response should then be multiplied by the session duration to produce a sRPE-TL (session RPE training load). This questionnaire could be administered via the “old-school” pen and paper method, but it’s much more efficient to use something like Google Forms, Microsoft Forms, or another alternative that will automatically save the data for later examination. Each of the questionnaire submissions should have a date and timestamp, which makes it easy to add all sessions for a specific day together to produce the daily training load.
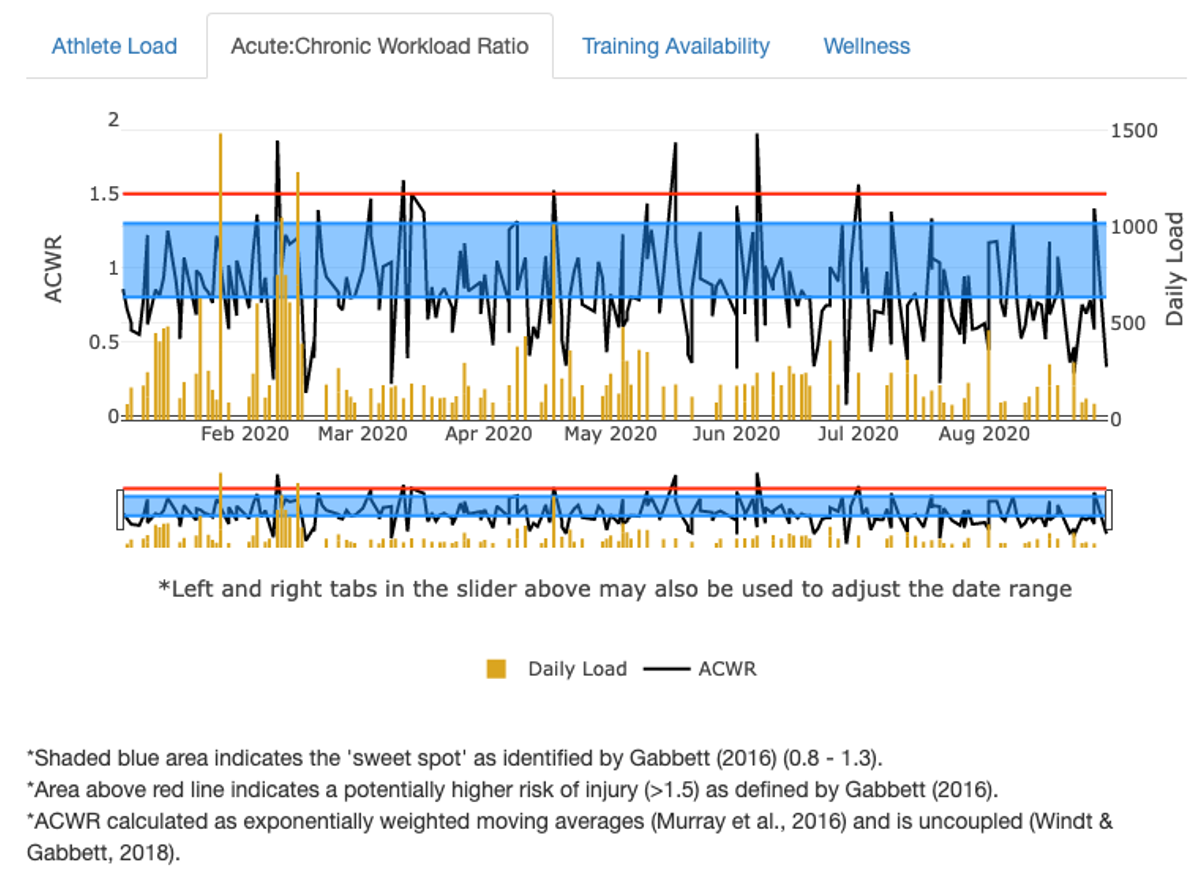
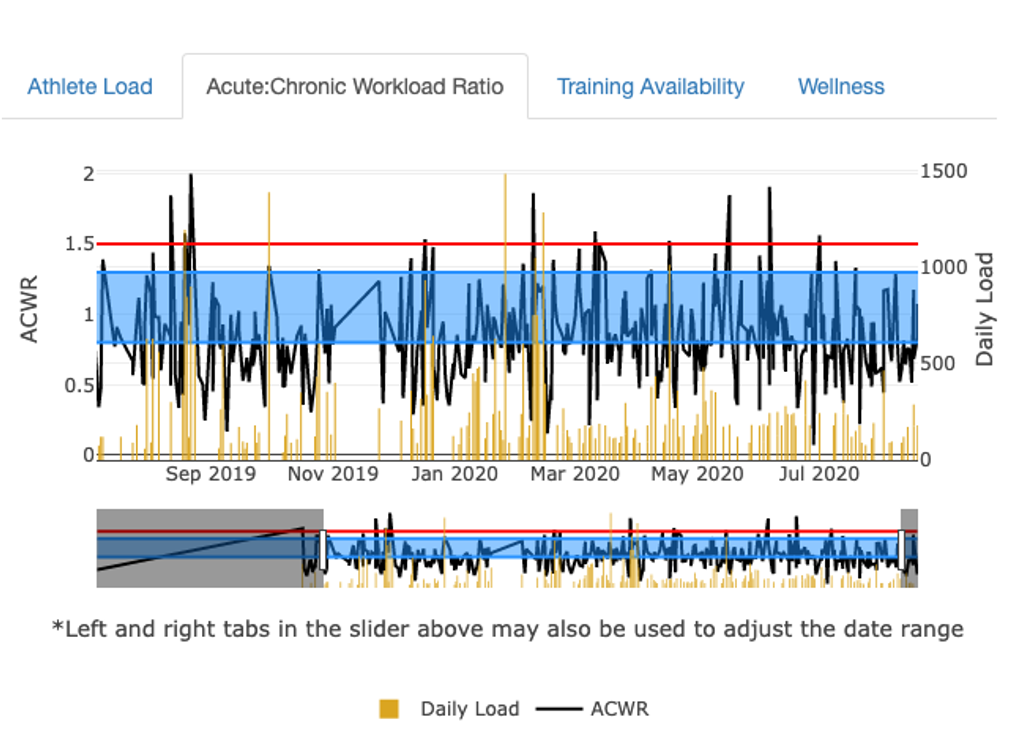
Workload Ratios and Injury Risk
Most of the recent research in this area has focused on comparing workloads and their development rates in hopes of shedding some light on the potential injury risk.7-9 The most popular method looks a the acute or 7-day workload to the chronic or 28-day workload. Ratios above 1.5 have been shown to be problematic in some publications, but others have questioned the validity of these methods.7-9[19][20][21] Due to the low cost of evaluating this, many sport scientists still track it since it helps many organize and adapt training to better suit athlete adaptation, even if it falls short of predicting injury potential or the cause and effect nature of it.
Wellness
Similar to RPE, wellness can be evaluated with questionnaires and they can also be administered electronically. In many cases, that means they are automatically emailed to athletes so that they can complete them on their own devices.
These are generally subjective in nature, but athletes answer items with a number scale, so the trends are graphable. One criticism of this is that some athletes may have different perceptions of the same qualities as other athletes. This is still okay as long as each athlete reliably answers in the same way. So this may still be useful to signal changes. But, these should not be used to compare different athletes.
Much like we discussed earlier, the validity, reliability, and individual usefulness should be evaluated on a regular basis. Some common examples of areas and variables that can be quantified via wellness questionnaires appear in Figure 12.8 above.
Body Composition
Body composition may be regularly evaluated in sports, but there may not be a big focus on the percent of body fat depending on the sport. For many sports, increasing muscle mass is more predictive of sport performance, so that should likely be the focus. When working with large teams or with limited time allotments, BIA testing may be more common due to the speed of testing. As mentioned before, these units often are not as valid as some of the others, but that is improving, and they are often reliable. Reliability is imperative here as it will still allow us to see directional trends that might signal a change or need for concern. Of course, this is assuming evaluation is happening on a somewhat regular basis (monthly). When using a cheaper device that likely lacks validity, seeing a significant change might be the point when a more valid and thorough measurement is recommended.
Flexibility, Mobility, and Stability
Flexibility, mobility, and stability are popular concepts in the fitness industry, and they are often confused. Flexibility refers to the range of motion in a joint or series of joints and often only looks at the muscular limitations while neglecting any joint related issues. Mobility is the ability to move within a range of motion. All aspects related to range of motion are considered here, muscle, bone, connective tissue, and the nervous system. Both flexibility and mobility are often measured actively with the subject putting themselves through the movement or passively with a tester moving the subject. Stability is the ability to maintain control of movement and body positions. As such, athletes could demonstrate great stability in a limited ROM, but poor stability when the ROM is increased.
Most of the recent research in this area attempts to connect injury to issues with either or a combination of the concepts above. Unfortunately, most research is inconclusive or negative.[22][23] That being said, dysfunctional movement may be a detriment to performance in sport or in normal daily life, so assessment is a key first step.
As mentioned previously flexibility, mobility, and stability are quite popular in the fitness industry, but their usage in sport performance is a little less consistent. This is likely due to the lack of supporting evidence for its benefits and also due to poor reliability of many of its measures. Many ROM tests are pretty straightforward using a goniometer or some other device to objectively quantify the measure and these are usually reliable. Others have subjects perform specific movement while a “judge” evaluates the movement quality in terms of stability and mobility. Research evaluating the interrater reliability on these methods produces conflicting results.[24][25][26] This could be due to different judges interpreting the movement differently, or because they are providing different instructions for the same movement. Another potential reason could be the viewpoint of the activity. If a judge is standing directly in front of the athlete they will be able to see frontal plane motion well, but sagittal plane movements won’t be as visible and vice versa. As a result of these issues, it is recommended that the same judge or tester always be used and/or that all testers undergo extensive training. Furthermore, regular assessments of interrater reliability must be completed.
Best Practices for Measurement
Let’s review some of the concepts covered before as they apply to sport performance assessment.
As in any other environment, it is imperative to evaluate one's own reliability and validity when possible. It is statistically (and scientifically) irresponsible to assume that data are reliable and valid without evidence. Strictly standardizing testing methods will go a long way to making data reliable. Any variable that can be measured more than once should be and then the trial average or peak value should be used.[27] This will help to remove statistical noise and identify when outliers or artifacts happen during data collection and they can be fixed.
Focus on ecological validity when testing sport performance and athlete preparedness. When possible, you should also control for any variables that will negatively impact the validity of collected data.
More often than not, you will be dealing with small sample sizes in sport performance assessment. This is because your sample size is limited to the team or sport that you are working with. While increasing the size of the team/sport may help from a statistical perspective sport coaches and general managers aren't interested in adding roster spots just to help with statistical significance. Even though this likely means that you won’t be able to achieve statistical significance, but it should still be reported. You should also report measures of practical significance (effect sizes) as many you consult with will be more concerned with how much some finding actually matters in the real world.
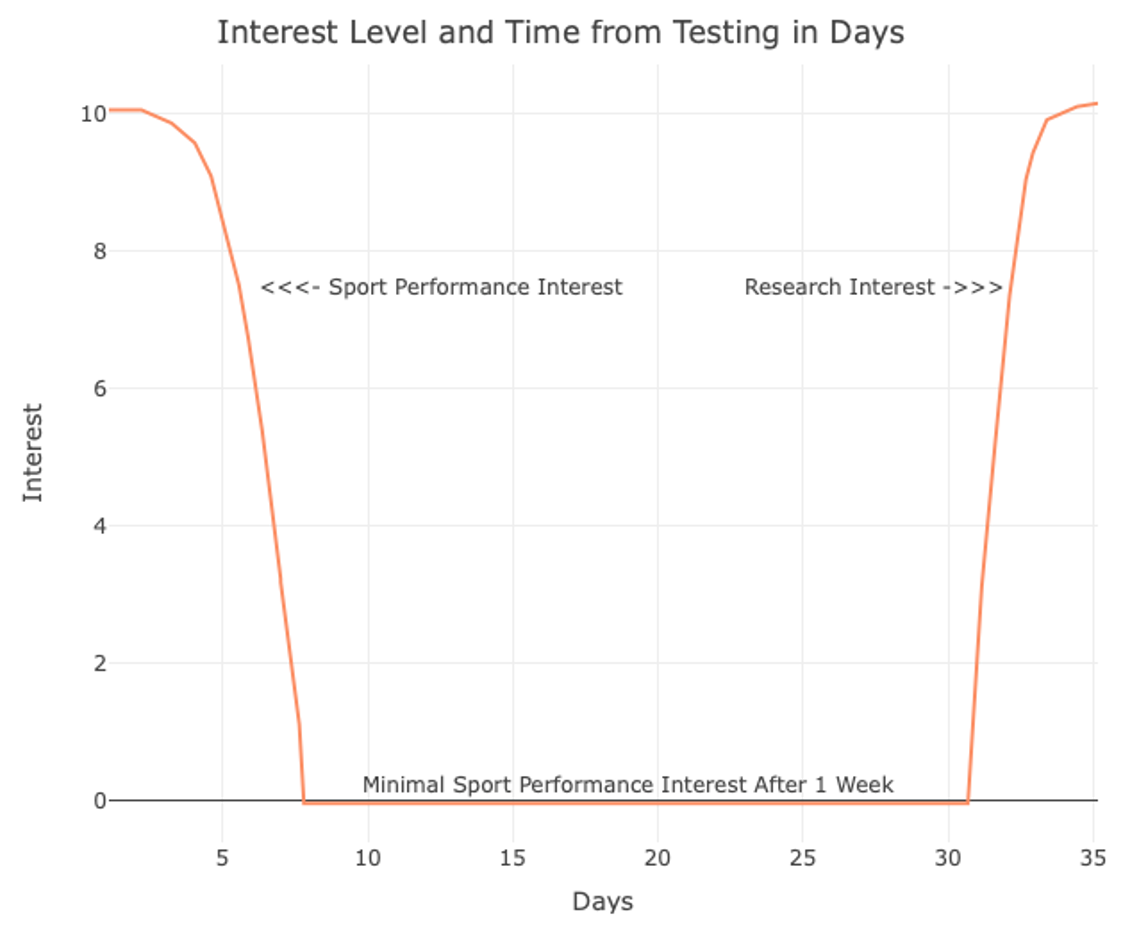
After testing, data needs to be analyzed and returned as quickly as possible. Athletes and coaches are likely interested in the results during the testing session, but the longer they have to wait, the more their interest decreases. This theoretical concept is depicted in Figure 12.18 below. After about 7 days, they may no longer care at all. From a research perspective, there may still be value, but coaches and athletes are concerned with winning now, not later when a research paper is finished.
Finally, repeated measures are vital if the goal is to monitor athlete development and by tracking changes. We can’t simply measure on 2 occasions and assume that the changes happened in a linear manner connecting the 2 points.
- Sands, W.A. (1991). Monitoring the elite female gymnast. National Strength and Conditioning Association Journal, 13(4):66-72. ↵
- Vaeyens, R., Lenoir, M., Williams, A.M., Phillipaerts, R.M. (2008). Talent identification and development programmes in sport : current models and future directions. Sports Med, 38(9):703-714. ↵
- Hoffman, J., Kaminsky, M. (2000). Use of performance testing form monitoring overtraining in elite youth basketball players. Strength and Conditioning Journal, 22(6):54-62. ↵
- Foster, C. (1998). Monitoring training in athletes with reference to overtraining syndrome. Med. Sci. Sports Exerc. 30:1164–1168. ↵
- Zatsiorsky, V.M. (1995). Science and Practice of Strength Training. Human Kinetics. Champaign, IL, USA. ↵
- Bailey, CA, Sato, K, Hornsby, WG, and Stone, MH. “Predicting offensive performance in collegiate baseball players using isometric force production characteristics.” In: TY Shiang, WH Ho, CF Huang, and CL Tsai, eds. Procedings of the 31st International Society of Biomechanics in Sports (ISBS) annual conference, Taipei, Taiwan. ↵
- Gabbett TJ. The training-injury prevention paradox: should athletes be training smarter and harder? Br J Sports Med. 2016 Mar;50(5):273-80. doi: 10.1136/bjsports-2015-095788. PMID: 26758673. ↵
- Murray NB, Gabbett TJ, Townshend AD, Blanch P. Calculating acute:chronic workload ratios using exponentially weighted moving averages provides a more sensitive indicator of injury likelihood than rolling averages. Br J Sports Med. 2017 May;51(9):749-754. doi: 10.1136/bjsports-2016-097152. ↵
- Windt J, Gabbett TJ. Is it all for naught? What does mathematical coupling mean for acute:chronic workload ratios? Br J Sports Med. 2019 Aug;53(16):988-990. doi: 10.1136/bjsports-2017-098925. ↵
- Moen, F., Myhre, K., Klöckner, C.A. (2017). Physical, Affective and Psychological determinants of Athlete Burnout. Sociology of Sport Journal. ↵
- Johnston, B. (2014). Exploring the Use of a Jumps Protocol as a Return-To-Play Guideline Following Anterior Cruciate Ligament Reconstruction Digital Commons East Tennessee State University. ↵
- Hill A.V. 1938 . The heat of shortening and the dynamic constants of muscle . Proc. R. Soc. Lond. B Biol. Sci. 126 :136 –195 . https://doi.org/10.1098/rspb.1938.0050 ↵
- Sayers SP, Harackiewicz DV, Harman EA, Frykman PN, Rosenstein MT. Cross-validation of three jump power equations. Med Sci Sports Exerc. 1999 Apr;31(4):572-7. doi: 10.1097/00005768-199904000-00013. ↵
- Sheppard, J. and Young, W. (2006). “Agility literature review: Classifications, training and testing.” Journal of Sports Sciences, 24(9), pp.919-932. ↵
- Nimphius, S, Geib, G, Spiteri, T, and Carlisle, D. (2013). Change of direction deficit measurement in division I American football players. J Aust Strength Cond, (21): 115–117. ↵
- Nimphius S, Callaghan SJ, Spiteri T, Lockie RG. (2016). Change of Direction Deficit: A More Isolated Measure of Change of Direction Performance Than Total 505 Time. J Strength Cond Res. Nov;30(11):3024-3032. ↵
- McGuigan, M. (2017). Quantifying Training Stress. In McGuigan, M. Monitoring Training and Performance in Athletes. (69-101). Human Kinetics. Champaign, IL, USA. ↵
- Foster C, Florhaug JA, Franklin J, Gottschall L, Hrovatin LA, Parker S, Doleshal P, Dodge C. A new approach to monitoring exercise training. J Strength Cond Res. 2001 Feb;15(1):109-15. ↵
- Impellizzeri FM, Woodcock S, Coutts AJ, Fanchini M, McCall A, Vigotsky AD. (2021). What Role Do Chronic Workloads Play in the Acute to Chronic Workload Ratio? Time to Dismiss ACWR and Its Underlying Theory. Sports Med; 51(3):581-592. doi: 10.1007/s40279-020-01378-6. ↵
- Impellizzeri FM, Tenan MS, Kempton T, Novak A, Coutts AJ. (2020). Acute:Chronic Workload Ratio: Conceptual Issues and Fundamental Pitfalls. Int J Sports Physiol Perform; 5:1-7. doi: 10.1123/ijspp.2019-0864. ↵
- Zouhal, H., Boullosa, D., Ramirez-Campillo, R., Ali, A., & Granacher, U. (2021). Editorial: Acute: Chronic Workload Ratio: Is There Scientific Evidence?. Frontiers in physiology, 12, 669687. https://doi.org/10.3389/fphys.2021.669687 ↵
- Moran, R. W., Schneiders, A. G., Mason, J., & Sullivan, S. J. (2017). Do Functional Movement Screen (FMS) composite scores predict subsequent injury? A systematic review with meta-analysis. British journal of sports medicine, 51(23), 1661–1669. https://doi.org/10.1136/bjsports-2016-096938 ↵
- Gleim, G. W., & McHugh, M. P. (1997). Flexibility and its effects on sports injury and performance. Sports medicine (Auckland, N.Z.), 24(5), 289–299. https://doi.org/10.2165/00007256-199724050-00001 ↵
- Moran, R. W., Schneiders, A. G., Major, K. M., & Sullivan, S. J. (2016). How reliable are Functional Movement Screening scores? A systematic review of rater reliability. British journal of sports medicine, 50(9), 527–536. https://doi.org/10.1136/bjsports-2015-094913 ↵
- Minick, K. I., Kiesel, K. B., Burton, L., Taylor, A., Plisky, P., & Butler, R. J. (2010). Interrater reliability of the functional movement screen. Journal of strength and conditioning research, 24(2), 479–486. https://doi.org/10.1519/JSC.0b013e3181c09c04 ↵
- Shultz, R., Anderson, S. C., Matheson, G. O., Marcello, B., & Besier, T. (2013). Test-retest and interrater reliability of the functional movement screen. Journal of athletic training, 48(3), 331–336. https://doi.org/10.4085/1062-6050-48.2.11 ↵
- Kahneman, D., Sibony, O., and Sunstein, C. (2021). Noise: A flaw in human judgement. Little, Brown Spark. New York, NY, USA. ↵
