
8 Chapter 8: Putting It All Together: Understanding and Assessing Criminal Justice Research
CASE STUDY: Developing a Valid Racial Profiling Benchmark
Research Study
Testing for Racial Profiling in Traffic Stops from Behind a Veil of Darkness1
Research Question
Can a valid benchmark for racial profiling be established?
Methodology
As part of an effort to address public concerns about racial profiling, many police departments collect data on the traffic stops that their officers make. For each traffic stop made, the officer documents the race of the driver. The department can then determine what percentage of traffic stops involves white drivers and what percentage involves black drivers. The key problem in testing for racial profiling in traffic stops is identifying a valid benchmark against which to compare the race distribution of the stopped drivers. Departments know the racial breakdown of traffic stops, but what do they compare the numbers to in an effort to assess racial disparities in traffic stops?
A benchmark should approximate the racial composition of the population that could be legitimately stopped by the police, given their patrol deployment patterns and race neutrality in stopping vehicles.2 Currently, there are two common benchmarks used in racial profiling analysis. First, many studies use residential population data as the benchmark. It is widely recognized that residential population data, obtained through the U.S. Census, provide poor estimates of the population at risk of a traffic stop. In other words, residential population data is not a valid benchmark with which to compare traffic stop data. The residential population includes people who do not drive, and the driving population in many places includes people who are not residents. Second, some police departments have commissioned traffic surveys that then serve as the benchmark to which the agency compares its traffic stop data. Traffic surveys involve hiring trained observers that tally the race distribution of drivers at certain locations within the city. Traffic surveys also have limitations and are costly to carry out. It is estimated that a traffic survey costs $30,000 at a minimum, which few departments can afford.3
In this study, the researchers propose a new benchmark to test for racial profiling. The approach makes use of what the researchers call the �veil of darkness� hypothesis. This hypothesis asserts that police are less likely to know the race of a motorist before making a stop after dark than they are during daylight. If we assume that racial differences in traffic patterns, driving behavior, and exposure to law enforcement do not vary between daylight and darkness, then we can test for racial profiling by comparing the race distribution of stops made during daylight to the race distribution of stops made after dark. Basically, the racial distribution of traffic stops at night serves as the benchmark that we then compare to the racial distribution of traffic stops during the day. Evidence of racial profiling exists, for example, if black motorists are more likely to be stopped during the day than at night.
The location for this study was Oakland, California. The Oakland Police Department (OPD) had received several complaints by motorists and advocates that OPD officers engaged in racial profiling, discriminating in particular against black drivers. The data provided to substantiate the allegations involved the use of residential population data as the benchmark; 56% of the drivers stopped by the OPD were black, whereas blacks comprised only 35% of the city�s residential population. The OPD entered into a legal settlement agreement with the U.S. Department of Justice requiring that they collect traffic stop data on an ongoing basis and regularly monitor the data to detect racial profiling.
The data analyzed included all reported vehicle stops carried out by OPD officers between June 15 and December 30, 2003, amounting to a total of 7,607 stops. The data included the race of the stopped driver and the time of the stop. The authors defined daylight as extending from sunrise to sunset. The remaining times were considered dark. Of the 7,607 stops in the database, the authors omitted 329 that were made pursuant to a criminal investigation, where the use of race as an identifying factor is explicitly allowed by law. Another 549 stops were lacking race or time information, so they were excluded as well.
Results
Overall, 45% of the drivers stopped were white and 55% were black. When divided by time of day, 51% of the drivers stopped during daylight were white while 49% were black. During dark hours, 35% of the stopped drivers were white while 65% were black. Recall that the racial distribution of traffic stops at night serves as the benchmark that we then compare to the racial distribution of traffic stops during the day. Evidence of racial profiling exists if black motorists are more likely to be stopped during the day than at night. This study found the direct opposite. Black drivers were more likely to be stopped at night (65% of the stops involved black drivers) than during the day (49% of the stops involved black drivers). If anything, the numbers and comparison discussed previously suggest reverse profiling, because it shows that white drivers are disproportionately stopped during daylight when visibility is high.
However, the researchers assumed that racial differences in travel patterns, driving behavior, and exposure to law enforcement do not vary between daylight and darkness, but these assumptions may not be true. The assumption that travel patterns are similar in the day and the night may be inaccurate, because the time of employment is known to vary by race.4 To deal with this issue, the researchers made use of the natural variation in hours of daylight over the year. In the winter, it is dark by early evening, whereas in the summer it stays light much later. Recall that the data used in this study were from June 15 through December 30, 2003. Limiting the analysis to stops occurring during the intertwilight period (i.e., between roughly 5 and 9 PM), the researchers could test for differences in the racial distribution of traffic stops between night and day, while controlling for racial variation in travel patterns by time of day.
The second analysis done by researchers was of traffic stops that occurred between 5 and 9 PM, which we will refer to as the intertwilight sample. Depending on the date of the stop, some of the stops were made during daylight and some during dark. Using the intertwilight sample, the authors found that 52% of the drivers stopped during daylight hours were black while 57% of the drivers stopped when it was dark were black. Recall that evidence of racial profiling exists if black motorists are more likely to be stopped during the day than at night. Once again, this analysis provides little evidence of racial profiling in the OPD.
Limitations with the Study Procedure
Although the previous results suggest there is no racial profiling in traffic stops in the OPD, those results hinge on the assumptions that racial differences in travel patterns, driving behavior, and exposure to law enforcement do not vary between daylight and darkness. As noted previously, the assumptions may not be true. The researchers were able to control for differences in travel patterns between daylight and darkness by limiting their analysis to only those traffic stops that occurred between 5 PM and 9 PM (i.e., intertwilight sample). However, the researchers were unable to control for any racial differences in driving behavior and exposure to law enforcement between daylight and darkness. If the assumptions are not true, then the results can be questioned.
Despite the terms of the court settlement that require data collection on every traffic stop conducted by the OPD, there is evidence of a substantial non-reporting problem in the data. An audit of the traffic stop reports led the OPD�s Independent Monitoring Team to estimate that as many as 70% of all motor vehicle stops were not reported in the early phases of this study. Court-ordered oversight and increased officer sanctions for noncompliance raised the number of completed stop forms, especially in October, November, and December. Therefore, the data are not a reflection of all traffic stops but just those that were documented by the officer who made the stop. The extent to which there were racial disparities in reporting (i.e., officers were more likely to not provide documentation on stops of black drivers), then the results can be questioned.
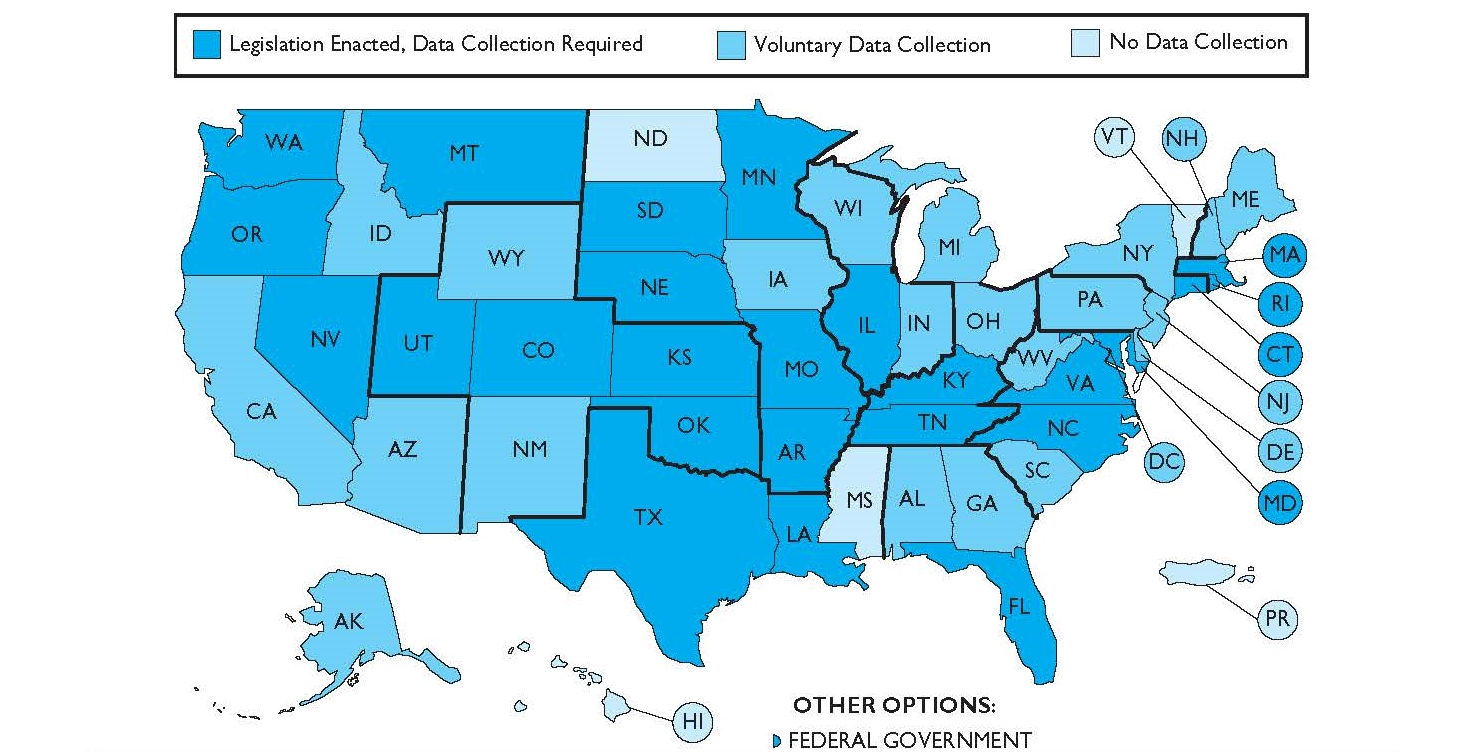
FIGURE 8.1 | Jurisdictions Currently Collecting Traffic Stop Data�2012
In order to validate the proposed benchmark, replication is required. No one study can by itself establish a sufficient base of knowledge to validate this benchmark. As of the middle of 2012, only four studies utilizing this methodology have been done, so we have a long way to go in validating the veil of darkness as a benchmark in racial profiling research.5
Police agencies throughout the country collect information on the race of drivers stopped by police (see Figure 8.1). As of 2012, 25 states had enacted legislation requiring racial profiling data collection by law enforcement agencies in the state.6 Another 21 states and the District of Columbia have some police agencies that voluntarily collect data on traffic stops for racial profiling analysis. Only the states of Hawaii, Mississippi, North Dakota, and Vermont do not have any known police agencies that collect traffic stop information for racial profiling assessment purposes.7
There is plenty of data collection on racial profiling happening throughout the country. This data is then analyzed by the police agency or researchers to determine if racial profiling is occurring within the agency. As is clear from the preceding research article, the problem is there is no valid benchmark for racial profiling assessments. Without a valid benchmark, the traffic stop data cannot be used to make a determination if a police agency is engaging in racial profiling.
The veil of darkness method described in this article might be the right approach. There is still plenty of work that needs to be done to demonstrate that the veil of darkness method is a valid benchmark for racial profiling analysis, but this approach is currently the most useful, cost-effective benchmark yet devised.8
In This Chapter You Will Learn
The steps in the research process
The structure of research articles and reports
What questions to ask and answer about each section of a research article
About external indicators of research quality
How to assess the internal indicators of research quality
How to critique a research article
Introduction
We hope your adventure through research methods has been an enjoyable one. It is now time to put the material you have learned into practice. In this chapter, we will revisit the steps in the research process covered in Chapter 1. Since the past several chapters have focused on specific research tools, it is important to once again see the big picture of research methods, so we will review the steps in the research process once again. After this, we will discuss the structure of research articles and reports so you will be prepared to read research articles. Understanding the structure of these documents will greatly assist you as you move forward as an educated consumer of research. Along with an overview of the structure of research articles and reports, a set of questions that you should ask as you read each section of a research article will be presented. The questions will serve as a helpful guide as you move forward in evaluating research documents and putting what you have learned in this book and in your class into practice.
The next two sections of this chapter will discuss how to determine the quality of a research article. In other words, how do you know if a research article is �good� and how do you go about assessing the specific details provided in research articles? This section is the culmination of your efforts throughout this semester. Now that you have the knowledge necessary to be an educated consumer of research, this section will provide you the specific tools necessary to know what questions to ask and what documentation to look for as you review and assess research articles. The sections are divided into two categories: external indictors of quality research and internal indicators of quality research. Finally, the last section of this chapter will provide an example of a research article critique. Using experimental design as the template, we will ask and answer a set of questions regarding the Minneapolis Domestic Violence Experiment (also covered in Chapter 5). The questions and answers will allow you to make an educated decision regarding the quality of the research. This will serve as a practical example of what you can do in the future as you put your knowledge of research methods into practice in both your academic and professional careers and your personal life.
The Research Process
Although this section was previously covered in Chapter 1, it is important to, once again, review the steps in the research process. Over the past several chapters, we have reviewed several specific research tools, designs, and methods. As you studied the specifics of research methods in each separate chapter, you may have lost focus of the �big picture� and how these different pieces fit together to form a comprehensive understanding of research methods. At the beginning of this chapter, it is important once again to look at the �big picture� to see how all these different tools, designs, and methods come together in the research process. When you read this information the first time in Chapter 1, you were in your first week of class and still may have been quite anxious about understanding this material. Now that you have almost completed the course, the steps should be easy to understand. What was once possibly a foggy understanding of the steps in the research process in Chapter 1 should now be crystal clear.
One of the nice things about studying research methods is it is about learning a process. Research methods can be seen as a sequential process with the first step being followed by the second step, and so on. There are certainly times when the order of the steps may be modified, but researchers typically follow the same process for each research study they complete regardless of the research topic. Very simply, a research problem or question is identified, and a methodology is selected, developed, and implemented to answer the research question. This sequential process is one of the advantages of understanding research methods, because once you understand the process, you can apply that process to any research question that interests you. In addition, research methods are the same across disciplines. So, sampling is the same in business as it is in health education as it is in criminal justice. Certainly the use of a particular method will be more common in one discipline in comparison to another, but the protocol for implementing the method to complete the research study is the same. For example, field research (discussed in Chapter 6) is used much more frequently in anthropology than in criminal justice. However, the research protocol to implement field research is the same whether you are studying an indigenous Indian tribe in South America in anthropology or a group of heroin users in St. Louis in criminal justice.
Some authors have presented the research process as a wheel or circle, with no specific beginning or end. Typically, the research process begins with the selection of a research problem and the development of research questions or hypotheses (discussed in Chapter 2). It is common for the results of previous research to generate new research questions and hypotheses for the researcher. This suggests that research is cyclical, a vibrant and continuous process. When a research study answers one question, the result is often the generation of additional questions, which plunges the researcher right back into the research process to complete additional research to answer these new questions.
In this section, a brief overview of the research process will be presented. Although you will probably not be expected to conduct a research study on your own, it is important for an educated consumer of research to understand the steps in the research process. The steps are presented in chronological order and appear neatly presented. In practice, the researcher can go back and forth between the steps in the research process.
Step 1: Select a Topic and Conduct a Literature Review
The first step in the research process is typically the identification of a problem or topic that the researcher is interested in studying. Research topics can arise from a wide variety of sources, including the findings of a current study, a question that a criminal justice agency needs to have answered, or the result of intellectual curiosity. Once the researcher has identified a particular problem or topic, the researcher assesses the current state of the literature related to the problem or topic. The researcher will often spend a considerable amount of time in determining what the existing literature has to say about the topic. Has the topic already been studied to the point that the questions in which the researcher is interested have been sufficiently answered? If so, can the researcher approach the subject from a previously unexamined perspective? Many times, research topics have been previously explored but not brought to completion. If this is the case, it is certainly reasonable to examine the topic again. It is even appropriate to replicate a previous study to determine whether the findings reported in the prior research continue to be true in different settings with different participants. This step in the research process was discussed in Chapter 2.
Step 2: Develop a Research Question
After a topic has been identified and a comprehensive literature review has been completed on the topic, the next step is the development of a research question or questions. The research question marks the beginning of your research study and is critical to the remaining steps in the research process. The research question determines the research plan and methodology that will be employed in the study, the data that will be collected, and the data analysis that will be performed. Basically, the remaining steps in the process are completed in order to answer the research question or questions established in this step. The development of research questions was discussed in Chapter 2.
Step 3: Develop a Hypothesis
After the research questions have been established, the next step is the formulation of hypotheses, which are statements about the expected relationship between two variables. For example, a hypothesis may state that there is no relationship between heavy metal music preference and violent delinquency. The two variables stated in the hypothesis are music preference and violent delinquency. Hypothesis development was discussed in Chapter 2.
Step 4: Operationalize Concepts
Operationalization involves the process of giving the concepts in your study a working definition and determining how each concept in your study will be measured. For example, in Step 3, the variables were music preference and violent delinquency. The process of operationalization involves determining how music preference and violent delinquency will be measured. Operationalization was discussed in Chapter 2.
Step 5: Develop the Research Plan and Methodology
The next step is to develop the methodology that will be employed to answer the research questions and test the hypotheses. The research methodology is the blueprint for the study, which outlines how the research is to be conducted. The research questions will determine the appropriate methodology for the study. The research design selected should be driven by the research questions asked. In other words, the research questions dictate the methods used to answer them. The methodology is basically a research plan on how the research questions will be answered and will detail:
1. What group, subjects, or population will be studied and selected? Sampling was discussed in Chapter 3.
2. What research design will be used to collect data to answer the research questions? Various research designs were covered in Chapters 4�7.
You need to have familiarity with all research designs so that you can become an educated consumer of research. A survey cannot answer all research questions, so knowing a lot about surveys but not other research designs will not serve you well as you assess research studies. There are several common designs used in criminal justice and criminology research, and brief descriptions of some of them are presented next. At this point in the semester, you should be completely familiar with each of these designs since they have been detailed in prior chapters.
Survey Research is one of the most common research designs employed in criminal justice research. It obtains data directly from research participants by asking them questions and is often conducted through self-administered questionnaires and personal interviews. For example, a professor might have her students complete a survey during class to understand the relationship between drug use and self-esteem. Survey research was discussed in Chapter 4.
Experimental Designs are used when researchers are interested in determining whether a program, policy, practice, or intervention is effective. For example, a researcher may use an experimental design to determine if boot camps are effective at reducing juvenile delinquency. Experimental designs were discussed in Chapter 5.
Field Research involves researchers studying individuals or groups of individuals in their natural environment. The researcher is observing closely or acting as part of the group under study and is able to describe in depth not only the subject�s behaviors, but also consider the motivations that drive their behaviors. For example, if a researcher wanted to learn more about gangs and their activities, he may �hang out� with a gang in order to observe their behavior. Field research was discussed in Chapter 6.
Case Studies A case study is an in-depth analysis of one or a few illustrative cases. This design allows the story behind an individual, a particular offender, to be told, and then information from cases studied can be extrapolated to a larger group. Often these studies require the review and analysis of documents such as police reports and court records and interviews with the offender and others. For example, a researcher may explore the life history of a serial killer to try and understand why the offender killed. Case studies were discussed in Chapter 6.
Secondary Data Analysis occurs when researchers obtain and reanalyze data that was originally collected for a different purpose. This can include reanalyzing data collected from a prior research study, using criminal justice agency records to answer a research question, or conducting historical research. For example, a researcher using secondary data analysis may analyze inmate files from a nearby prison to understand the relationship between custody level assignment and disciplinary violations inside prison. Secondary data analysis was discussed in Chapter 7.
Content Analysis requires the assessment of content contained in mass communication outlets such as newspapers, television, magazines, and the like. In this research design, documents, publications, or presentations are reviewed and analyzed. For example, a researcher utilizing content analysis might review true crime books involving murder to see how the characteristics of the offender and victim in the true crime books match reality as depicted in the FBI�s Supplemental Homicide Reports. Content analysis was discussed in Chapter 7.
Despite the options these designs offer, other research designs are available and were discussed in previous chapters. Ultimately, the design used will depend on the nature of the study and the research questions asked.
RESEARCH IN THE NEWS
Road Rage Common Among Commuters9
A recent survey found that almost 60% of the respondents who drive to work said they experience road rage at times while traveling to and from the office. These findings are similar to the results found in 2006, which was the last time the study was conducted. Nearly one in ten (9%) workers who drive to work have gotten into a fight with another commuter. While incidents of road rage are more prevalent among those with long commutes, workers with short trips to their jobs are not immune. Of workers with commutes of less than 5 minutes, 37% said they experience road rage from time to time. The same goes for 54% of workers with commutes of less than 10 minutes.
Women are more apt to feel road rage; 61% compared to 56% of men. In terms of age groups, workers ages 25 to 34 were the most likely to experience road rage at 68%, while workers 55 and older were the least likely to experience road rage at 47%. The survey was completed online by 3,892 U.S. workers who were employed full-time. Workers who were self-employed or worked for the government were excluded from the survey. The survey was completed by workers 18 years of age and older and was conducted between May 14 and June 4, 2012.
Step 6: Execute the Research Plan and Collect Data
The next step in the research process is the collection of the data based on the research design developed. For example, if a survey is developed to study the relationship between gang membership and violent delinquency, the distribution and collection of surveys from a group of high school students would occur in this step. Data collection was discussed in several chapters throughout this text.
Step 7: Analyze Data
After the data have been collected, the next phase in the research process involves analyzing the data through various and appropriate statistical techniques. The most common means for data analysis today is through the use of a computer and statistically oriented software. Data analysis and statistics are discussed in Chapter 9.
Step 8: Report Findings, Results, and Limitations
Reporting and interpreting the results of the study are the final steps in the research process. The findings and results of the study can be communicated through reports, journals, or books. At this step, the results are reported and the research questions are answered. In addition, an assessment is made regarding the support or lack of support for the hypotheses tested. It is also at this stage that the researcher can pose additional research questions that may now need to be answered as a result of the research study. In addition, the limitations of the study will be described by the researcher as well as the impact the limitations may have on the results of the study. All research has limitations, so it is incumbent on the researcher to identify those limitations for the reader.
Structure of Research Articles and Reports
As noted in the prior section, research methods can be seen as a sequential process as depicted in the steps in the research process. The question then becomes, what do researchers do with all the data and information they collect in their research projects? The answer is they write journal articles, research reports, and books. One of the advantages of reading research articles is their structures are usually very similar. It is helpful as an educated consumer of research to understand the common structure of research articles and reports. You will be able to easily identify these sections as you review research articles and reports in the future.
Before we discuss the structure of research articles and reports, it is necessary to mention the three main publication outlets for research articles. First, a common outlet for a researcher�s study and results is a journal article. Journal articles appear in thousands of journals covering the gamut of academic disciplines from accounting to zoology. Researchers write manuscripts based on their research projects and then submit them to journals for publication. Later in this section, we will discuss how to assess the quality of a journal. For now, it is important to recognize that journals are a critical outlet for research articles. Second, another place to find research is in reports that are published by government agencies, private companies, and businesses. For our specific purposes, this includes government documents produced by state and federal agencies such as the U.S. Department of Justice and local, state, and federal criminal justice agencies. Thousands of documents each year are published as reports with many available online. Reports are similar in structure to journal articles; however, reports are usually more detailed than journal articles, which have limited space for details such as the research methods used in the study and the results. Furthermore, reports typically do not include a literature review. Due to these similarities, reports can be evaluated in much the same way as journal articles. Third, books are sometimes used as a primary source to document a research study. Due to the magnitude of the study, a book-length manuscript is developed to document the research methodology and findings. University presses (e.g., Cornell University Press and University of Texas Press) commonly print research projects and their results as books.
Most published research follows a basic format, which will be reviewed in this section. Although the structure described next will vary slightly depending on the research methods utilized and will vary by discipline and the requirements of the publication outlet, most research reports that are published follow a similar format. Consumers of research grow accustomed to seeing the same basic information in each published research article. By knowing the structure of a research article and the general information that is included in each of the sections, research consumers can be less anxious about reading published research. This format also provides a structure for researchers to follow when writing up their research. This format includes a title, abstract, introduction, literature review, methodology, findings, discussion, conclusion, and references. Each will be described next along with questions that an educated consumer of research should ask regarding each part of a research article.
Title
Titles help research consumers quickly identify if the journal, article, or book may be of interest to them. The title should provide the research consumer with a general idea of the article topic and perhaps the main variables assessed in the study. Some evaluative questions to ask regarding the title of a research article include:
1. Is the title concise and specific?
2. Are the main variables and research subjects included in the title?
3. Is the title free of jargon and acronyms that may not be generally recognized by research consumers?10
Abstract
The abstract is typically limited to 150�200 words, depending on the publication outlet. The abstract gives a short synopsis of the article, including the topic covered, the methodology, and the major findings of the research. The abstract provides a quick way for the research consumer to get an overview of the research study to see if more in-depth exploration is warranted. Some evaluative questions to ask regarding the abstract of a research article include:
1. Is the purpose of the study clearly stated in the abstract?
2. Does the abstract include the main points of the methodology used?
3. Does the abstract include the main findings?11
Introduction
In the introduction, the researcher should establish for the reader the importance of the research topic, the historical background of the problem, and the need for research in the area. For example, several strategies have been developed to reduce recidivism among convicted sex offenders (e.g., sex offender registration, community notification, residency restrictions, and civil commitment). This is obviously an important topic, and researchers want to find out which strategy works best at reducing recidivism. After the researcher has introduced the topic and its significance, the introduction should be narrowed down to the specific research project discussed in the article. Some evaluative questions to ask about the introduction include:
1. Does the researcher identify a specific problem area in the introduction?
2. Does the researcher establish the importance of the problem area?
3. Does the introduction start broadly and then narrow down to the specific research topic?
Literature Review
The literature review section provides a framework for the research by assessing the prior studies that have already been conducted on the topic. Basically, the literature review includes the pertinent prior studies that have addressed the topic of your research and have answered your research questions. The literature review provides a compilation of what is currently known about the topic under study. The literature review should also be critical and note the limitations in the prior research and identify the gaps in the literature where adequate research has not been conducted. The literature review should contain the most recent research studies on the topic as well. However, the literature review should not dismiss history, but instead should discuss the seminal studies on the topic. For example, if you are conducting a study on the factors that impact the decisions of police officers to arrest juvenile offenders, you would definitely want to include the article, discussed later in this chapter, by Piliavin and Briar: the seminal work on police discretion and juveniles.
The review of the literature may also include a description of the theoretical framework that was used for the study. The theoretical framework can put the development of the researchers� hypotheses into context. To demonstrate the link between the theoretical framework and hypothesis construction, some publications will place the hypotheses at the end of the literature review instead of at the beginning of the methodology section. Some evaluative questions to ask about the literature review include:
1. Does the literature review include current as well as seminal citations?
2. Is the literature review critical of the prior literature by noting its limitations?
3. Have gaps in the current literature been identified in the literature review?15
WHAT RESEARCH SHOWS: IMPACTING CRIMINAL JUSTICE OPERATIONS
Civil Commitment of Sex Offenders: Are the Right Offenders Identified and Public Safety Increased?12
In response to a growing perceived need to protect the public from sexual offenses, numerous public policies have been developed to manage and track convicted sex offenders. Although the most widely known of these initiatives are sex offender registration and community notification laws, many states have recently also enacted sex offender civil management laws (also commonly referred to as civil confinement/commitment laws or sexually violent predator [SVP] laws). These civil management laws are designed to protect the public while offering treatment to the offender, by allowing the civil confinement of those sex offenders deemed to be at high risk for sexual recidivism after they have completed their criminal justice sentences for certain sexual crimes. Twenty-two jurisdictions (20 states, District of Columbia, and the federal government) have enacted such laws.
New York is one of these states. In 2007, the State of New York enacted its Sex Offender Management and Treatment Act (SOMTA) to civilly manage those sex offenders deemed to be at high risk for sexual recidivism. Specifically, SOMTA allows the state to civilly manage sex offenders about to be released from state supervision who have mental abnormalities that predispose them to engage in repeated sex offenses, by either:
a. placing the offenders in the community on strict and intensive supervision and treatment (SIST); or
b. civilly confining those offenders deemed to be dangerous (i.e., unable to control their sexual offending behavior).
The study sought to inform the SOMTA review process by answering the following research questions:
1. Which variables are most influential in the SOMTA review process? And
2. Is the sex offender civil management process in New York correctly identifying high-risk offenders (and, therefore, likely increasing public safety)?
To answer the first research question, the researchers obtained data on all offenders reviewed for possible civil management from April 13, 2007, to November 12, 2008 (N = 1,991). Since SOMTA had only been enacted a year and a half before the study, a sufficient length of time had not yet passed for the sexual recidivism rates of the 1,991 offenders screened under SOMTA to be adequately judged. To overcome this challenge, the researchers created a historical cohort of New York sex offenders before the enactment of SOMTA. Offenders in the historical cohort were matched (on variables found to be important to the SOMTA review process) to those offenders actually reviewed under SOMTA. In other words, the offenders used to answer the second research question (i.e., the recidivism analysis) were never reviewed under SOMTA but were matched on risk factors to SOMTA-reviewed offenders. A total of 1,546 offenders were included in the matched historical cohort.
To answer the first research question, the researchers identified the demographic, criminal history, and victim variables that contributed most significantly to being deemed high risk and receiving a psychiatric exam. The greatest increase in the odds of an offender receiving a psychiatric exam was associated with the offender�s Static-99 score. The Static-99 is the most widely used instrument to conduct male sex offender risk assessments and has been found to be reliable and valid. Three other variables that made the SOMTA review process likely were having a male victim, age of the offender (with older offenders more likely to be reviewed), and number of prior sexual convictions. To answer the second research question, the researchers used the matched historical cohort. The data analysis revealed an overall 5-year sexual rearrest rate of 7.2%.
Taken as a whole, the results of the study supported the efficacy of the risk assessment process used in New York to identify those offenders most likely to recidivate sexually. The factors identified by the research most likely to be associated with an offender being high risk are the same ones identified in prior literature (i.e., Static-99 score, male victim, older offender, and number of prior sexual convictions). The researchers concluded that the results of the current study indicate that sex offender civil management is successful and is likely increasing public safety. This is important to the operation of the criminal justice system because the growing body of research indicates little, no, and sometimes even negative impacts on public safety resulting from sex offender registration and community notification,13 as well as sex offender residency restrictions.14 Thus, unlike sex offender registries, community notification, and residency restrictions, sex offender civil management appears from this study to be reducing sexual victimizations.
Methods
The methods section is where the material discussed in the prior chapters of this text is put into action to let readers know the details of how the research was conducted. It should provide details on the methods used by the researchers to gather data and answer the research questions and/or test the hypotheses. The methodology section includes a description of the research design, data sources, sampling strategy, variables and how they were measured, and data collection instruments used. Methods sections are often longer in quantitative studies than in qualitative studies. Explicit details of the methods used should be provided, because this section of the article provides much of the material needed by the consumer of research to evaluate the quality of the article. Unfortunately, this detail is not always provided, which leaves the consumer to make assumptions about the methods and their limitations.
Depending on the publication outlet, the limitations of the research study may also be included in the methods section of the research article. If the limitations are not discussed in the methods section, then they will be reviewed in the discussion or conclusion section. Complete transparency and full candor are expected as the researcher shows the reader that he acknowledges the limitations of the research and has thought through how the limitations can impact the results. For example, if the experimental design had several participants drop out of the program between the pre-test and the post-test, then the researcher needs to discuss how subject mortality can influence the results of the study. Similarly, if the survey researcher discovers some wording issues with one of the questions on the survey, then he should address this reliability issue and how it may impact the results of the study. No research is perfect, so it is incumbent upon the researcher to state the limitations and flaws in the research and to provide the information needed by the educated consumer of researcher to decide the magnitude of the limitations and their cumulative impact on the research findings.
In the methods section, the researcher should also discuss the statistical analysis of the data to be performed and reported in the results section of the article. Although the statistical tests performed can become quite technical and complex, it is important for the researcher to present information about the statistical tests so the consumer can become familiar with the techniques used in analyzing the data. Statistics will be discussed in Chapter 9.
It is impossible to develop a single checklist of the topics that need to be addressed in a methods section because the details that need to be provided depend on the methods used. For example, the response rate only needs to be included in the methods section when a survey has been conducted. Likewise, the sampling protocol is frequently a component of the methods section, but sampling is irrelevant when a case study is completed. Specific evaluative questions about the methodology section will not be presented here, but instead will be provided when the internal indicators of research quality are presented later in this chapter.
Results/Findings
The results section is a straightforward discussion of the research findings, but it is frequently the most difficult part of a research article to understand due to the statistical tests that may be used, especially for a newly educated consumer of research. At the beginning of the results section, a discussion of the sample is provided, along with appropriate statistical description, so the reader can understand the characteristics of the research subjects. The results section presents the findings of the research and answers each research question and/or tests each hypothesis.
For quantitative studies, the statistical analysis presented in the results section is typically presented in tables, charts, and graphs as well as described in the text. The tables often provide greater detail than what is described in words and also allow the reader to follow the description of the results provided in the article. In the results section, the researchers will also state whether there were any unexpected findings or findings that have not been discovered in the prior literature. The researcher will wait until the discussion section to discuss the reasons for the anomaly in detail, but she will typically point out the interesting finding when it is initially presented in the results section.
The presentation of data flows logically and a straightforward discussion of the main findings and their significance are presented in the results section. In qualitative research, the data are organized in a manner that illustrates a line of reasoning or tells a story. Some evaluative questions to ask about the results include:
1. What findings are statistically significant? (discussed in Chapter 9)
2. Does the author answer each research question and/ or address each hypothesis?
3. If there are tables, are the highlights discussed in the narrative of the results?
4. Are the results of qualitative studies adequately supported with examples of quotations or descriptions of observations?16
Discussion
Some research articles combine the discussion section with the results section, while others combine the discussion section with the conclusion section, while still others keep all three sections separate. We will present them as separate sections. In the discussion section of the article, the researcher is expected to interpret the findings of the research study and discuss their implications. The major findings are discussed and examined for agreement or disagreement with prior research findings as presented in the literature review portion of the article.
The researchers basically answer the following question: �Did the findings support the results of prior literature?� If yes, the author will note that his findings are consistent with prior research. If the answer is no, then the researcher will identify potential reasons for the unexpected finding. The unexpected finding may be due to a research limitation or the researcher may provide an analytical or theoretical framework to explain the odd finding. In a sense, the research article is presented in a circular manner. The literature review is presented followed by the methods and results section, and then in the discussion section, the findings are tied back to the prior literature presented in the literature review.
Depending on the type of research completed, the researchers will present in the discussion section the implications of the findings for prior literature, theory development, and policy and practice in the criminal justice system. Depending on the publication outlet, some research articles may include a few paragraphs on the policy implications of the research findings. Some evaluative questions to ask about the discussion include:
1. Do the researchers acknowledge specific methodological limitations and their potential impact on the findings (limitations may be covered in methods section)?
2. Are the results discussed in terms of the literature cited in the literature review?
3. Are the results discussed in terms of any relevant theories?17
4. Does the author offer speculations about what the results may mean and their implications?
Conclusion
In the conclusion, the researchers will first briefly summarize the research problem addressed in the study, the major results, and any significant unexpected findings. Then, the researchers provide the reader a broad perspective on the research findings and put the findings into context by demonstrating where the study results fit into the larger literature. The researchers will explain the benefits derived from the research and identify areas in need of further research.
Also, the researcher will discuss the generalizability of the findings. Can the findings be generalized to other populations, other settings, and other contexts? If so, the researcher will justify why the findings can be generalized within the selected parameters. If not, the researcher will discuss this limitation and its causes along with providing an explanation of what research needs to be done in the future to improve the generalizability of the results. Some evaluative questions to ask about the conclusion include:
1. Are specific implications discussed?
2. Are suggestions for future research specified?
3. Does the research extend the boundaries of the knowledge on a topic?18
4. Do the researcher�s conclusions concur with the results that were reported or does the author overgeneralize the findings?
References
The reference section of a research article gives the reader complete information about the previous research that was used in the study. Researchers need to provide citations for each source that was used in the research article. Many of the sources will have been used in the literature review section. The reader can use the reference list to obtain additional primary sources on the research topic. If you compare the references of several research articles on the same topic, you will be able to determine what seminal and critical articles exist on the research topic.
Some evaluative questions to ask about the references include:
1. Has the most recent research on the topic been included in the references?
2. Have the seminal articles on the topic been included in the references?
External Indicators of Research Quality
This section will focus on the external indicators of research quality. The external indicators can be identified without reading the research article. It is important to recognize that reading the article and identifying the internal indicators of research quality, which will be discussed in the next section, is a more valid measure of, and therefore a better way to assess, research quality. However, the external indicators can serve as a shortcut method to determine if the research article is worth further attention and assessment.
As previously discussed, the three main publication outlets for research articles are journal articles, reports, and books. Most of the focus of this section will be on journal articles since academic journals are the primary way that researchers disseminate the results of their research. Some of the indicators discussed next, such as university affiliation and researcher reputation, apply equally to journal articles, books, and reports, but a few comments about the indicators of quality books and reports are necessary before we delve into those topics.
For this section, we are referring to books used as a primary source to document a research study. In other words, due to the magnitude of the study, a book-length manuscript is developed to document the research methodology and findings. Secondary sources include textbooks, encyclopedias, and news reports. Secondary sources usually involve summaries of primary source work and, while they may offer some information related to the research methods used in the study, they often do not provide the detail you need to assess the quality of the research article without tracking down the original article (i.e., primary source).
For books as a primary source, one of the main factors to consider when determining the quality of research reported is to look at the book�s publisher. Books published by university presses (e.g., Cornell University Press and University of Texas Press) are typically high-quality manuscripts involving high-quality research. University presses, similar to some of the academic journals discussed next, have stringent manuscript review processes, so only the best manuscripts are printed by these publishers.
Similarly, for reports, you need to look at what organization published the research. If the report is published by a federal agency such as the U.S. Department of Justice, then it should be considered high quality. The U.S. Department of Justice and other federal agencies have full-time researchers that write research reports on data obtained by the agency, so the research is conducted and written by trained researchers. The same can be said for reports published by state agencies. There are also private companies (e.g., Rand Corporation) that routinely conduct research in criminal justice agencies and then publish the reports, which are frequently available on their websites. Much of this work completed by respected companies is high quality as well because trained, full-time researchers are conducting the research and reporting the results. The theme is that if the research is completed by a full-time researcher, then it is probably a quality piece of research. Of course, there will be exceptions to the general rule, but it is a good piece of information to remember as you move forward in assessing research articles.
You should be more skeptical of research reports completed by city or county criminal justice agencies. Most of these agencies do not have full-time researchers, so there is concern about the capabilities of the person who completed the research. That does not mean that a report completed by a county or city criminal justice agency cannot be high quality but rather that you should not assume it to be high quality based on the agency that produced it. These reports need further assessment to determine their quality. We will discuss three external indicators of quality research: researcher reputation, institutional reputation, and journal quality.
Researcher Reputation
Some researchers consistently produce top-quality research, so the research articles they write�whether as a book, report, or journal article�can be assumed to be high quality. There are researchers that are the best in their particular area of expertise and everything they produce is high quality. Often, the largest body of research in a particular area is done by the same person or the same group of people at a few different institutions. We will not name specific researchers who meet these requirements, but maybe your professor will. If you or your professor does not know the researcher, you can search for information about her on the Internet. You should be able to easily find the researcher�s curriculum vita (like a resume) online and look at her prior publications to see if she has written in this area before and where the prior research articles have been published.
Institutional Reputation
Another external indicator is the institutional affiliation of the researcher and its reputation. Just like journals discussed in the following section, some universities are better than others when it comes to research. Researchers who work at top-ranked research universities are going to have strict requirements to produce high-quality research and high-quality publications in order to maintain their employment. Although even the top-ranked research universities have some deadwood (we definitely are not going to name names), institutional reputation is a quick way to determine if the research article is high quality.
Journal Quality
As previously stated, academic journals are the primary way that researchers disseminate the results of their research. The journals vary in quality though. One measure of the quality of a journal is their manuscript review process. There are two types of journals: refereed and nonrefereed journals. Refereed journals use a peer-review process to review manuscripts. Peer review is a form of quality control most commonly related to academic journals. If a journal follows a peer review process, when a manuscript is submitted to the journal, it is sent out to be reviewed by two or more experts in the field to determine whether the manuscript is suitable for publication. The review is almost always a blind review, which means the reviewer does not know the name of the researcher who wrote the manuscript. This limits bias in the review process.
When a manuscript is submitted to a refereed journal, the journal editor will review the manuscript to see if it is of sufficient quality to send out for external review. Those that are not of sufficient quality are rejected by the journal editor and returned to the author. For those that are good enough to be externally reviewed, the editor will send the manuscript to two or more reviewers. Sometimes, these reviewers are members of the journal�s editorial board. Each reviewer evaluates the article, provides written comments to the editor, and recommends to either accept, reject, or send the manuscript back to the authors for revisions and reassessment after the revisions are made (commonly called �revise and resubmit�). After the reviews are completed, the editor makes the final decision on whether the manuscript will be accepted for publication, rejected, or sent back to the authors with a request to �revise and resubmit.�
Nonrefereed journals do not utilize the peer review process. The articles in nonrefereed journals will be reviewed by the journal editor and published in the order in which they are received or according to a fee that the author pays. Journals that are not peer reviewed do not garner as much respect from fellow researchers as there is less quality control of the material published. If you are not familiar with a particular journal, you can usually determine if it is a peer-reviewed journal by reading the material at the front of the journal. There is a section at the beginning of the journal (sometimes it is in the back) that will be titled something like �information for potential contributors,� which will provide information on the manuscript review process for the journal.
As an external indicator of research quality, research articles appearing in refereed journals will be higher quality than articles appearing in nonrefereed journals. Of course, there are exceptions to this statement, but it is a good principle to remember as you move forward as an educated consumer of research.
You have identified that the journal utilizes a peer-review process and so it is a refereed journal. Now what? Well, all refereed journals are not the same quality; some are better than others. So, how do you determine if the refereed journal is a high-quality journal? One indicator is the journal�s acceptance rate. The acceptance rate is the number of manuscripts accepted for publication divided by the number of manuscripts submitted to the journal for publication consideration. The lower the acceptance rate, presumably the better the quality of the journal. The acceptance rate can be difficult to obtain without directly contacting the journal editor, so it is not always available to the consumer of research.
Another indicator of the quality of the journal is the reputation of the journal editor. As stated previously regarding the reputation of the researcher, if the journal editor is one of the top researchers in the area covered by the journal, then that is an indication that the journal is high quality as well. Similarly, the reader can review the names of the editorial board members listed at the beginning of the journal. The better the reputations of the editorial board members, the better the reputation of the journal. In addition, the university affiliation of each editorial board member will be presented in the journal. If the journal has several editorial board members that come from major research universities, then this is an indication that the journal is of high quality. These three indicators (acceptance rate, editor reputation, and editorial board composition) are used by research consumers to assess the quality of the journal, but a new indicator has been developed in recent years to measure journal quality: the impact factor.
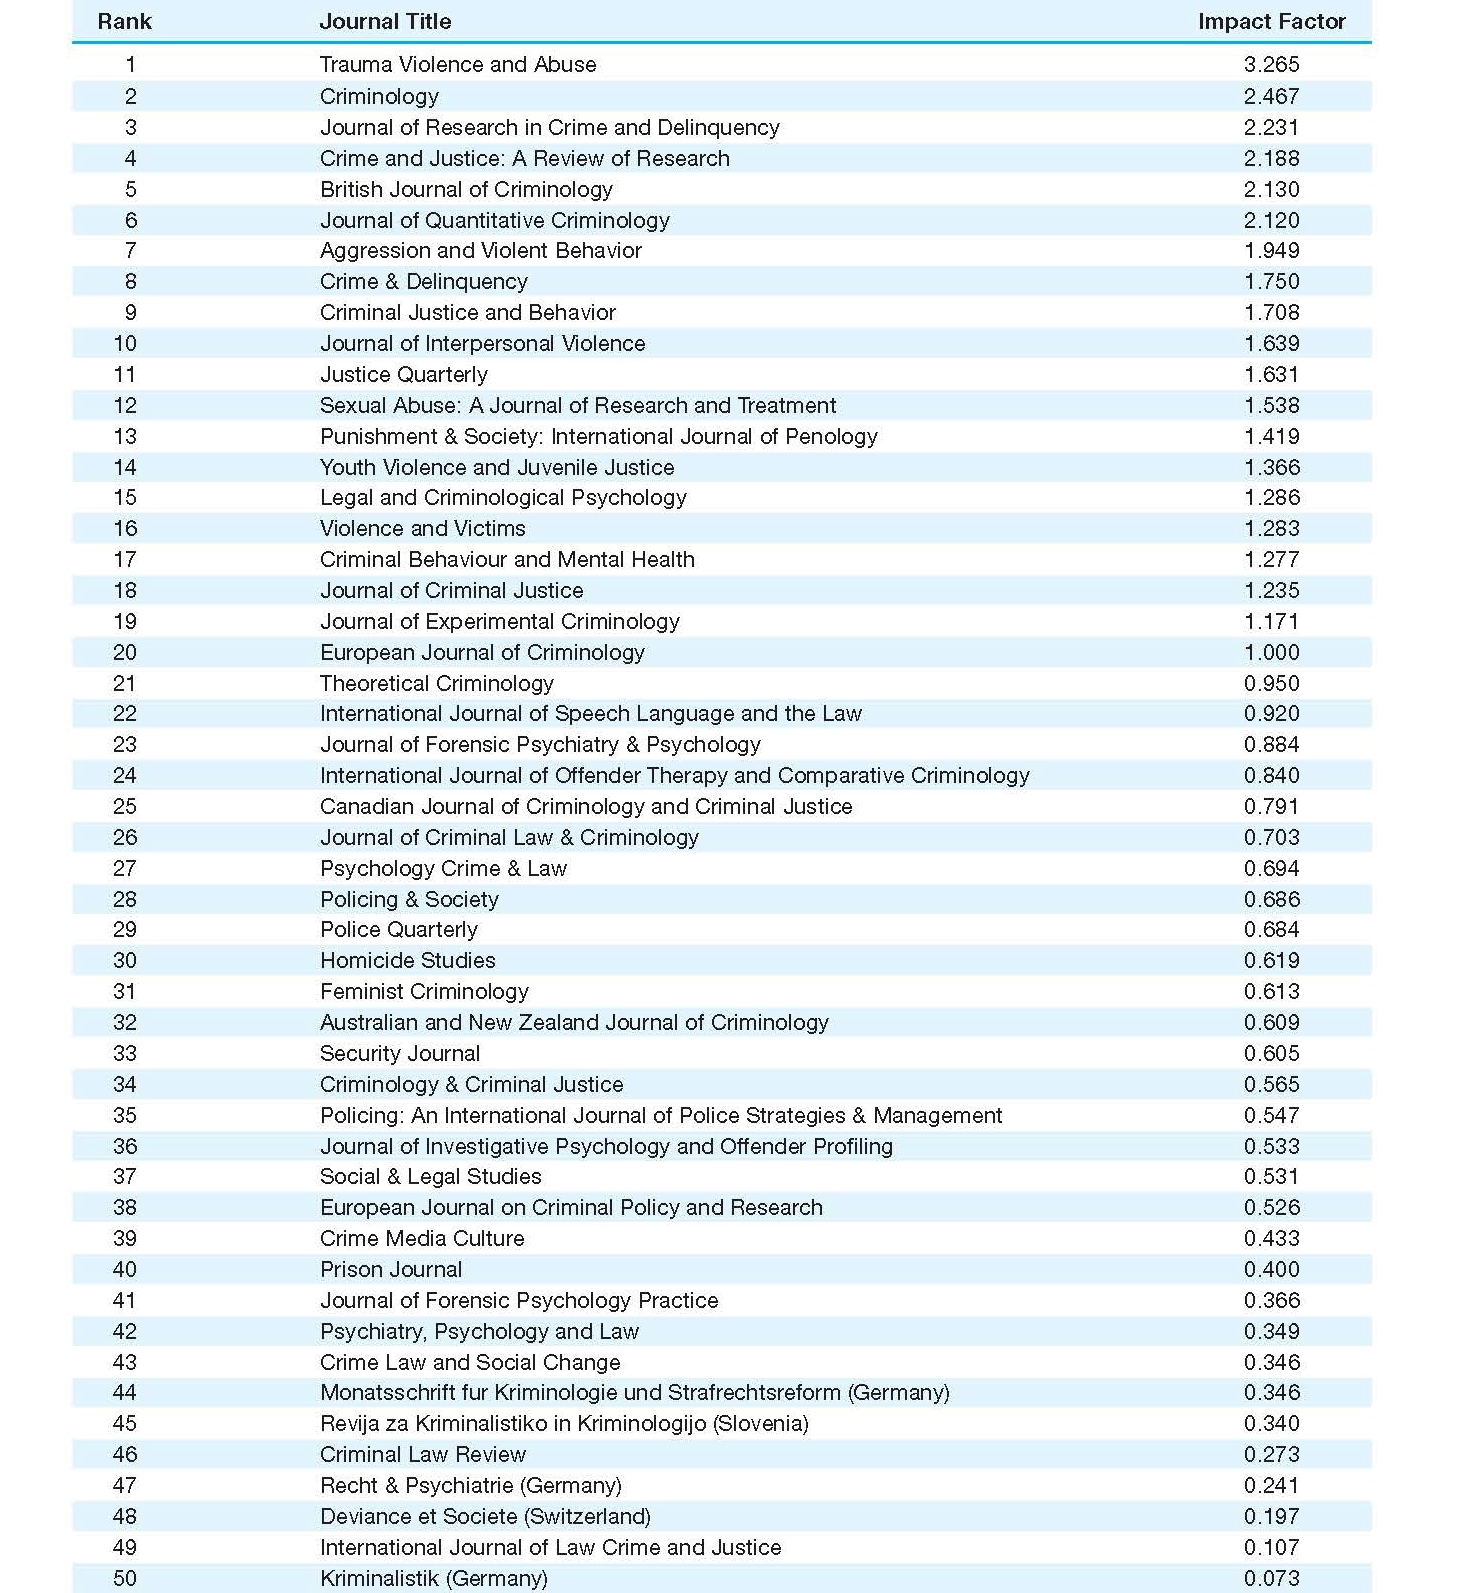
Impact Factor The impact factor is a measure of the frequency with which the average article in a journal has been citied in a particular year. It is an evaluation tool that is annually provided by the company Thomson Reuters in the Journal Citation Reports. A journal�s impact factor is the average number of times articles from the journal, published in the past two years, have been cited. The latest year available at the time of this writing is 2011. The impact factor for 2011 was calculated as the number of citations in 2011 to articles published in the journal in 2009 and 2010 divided by the number of articles published in the journal in 2009 and 2010. The higher the impact factor, the higher the journal quality. The idea behind the impact factor is that if other researchers are citing the material from the journal�s articles, then this is an indication that the journal�s articles are high quality and thus the journal is a quality venue for published research.
The top-ranked journals of the 2011 Journal Citation Reports in the criminology and penology category which is where criminal justice and criminology journals are ranked, are:
1. Trauma Violence and Abuse (impact factor�3.265);
2. Criminology (impact factor�2.467);
3. Journal of Research in Crime and Delinquency (impact factor�2.231);
4. Crime and Justice: A Review of Research (impact factor�2.188), and;
5. British Journal of Criminology (impact factor�2.130)
A list of the top 50 journals in criminal justice and criminology are presented in Figure 8�2. You can assume that the articles in the higher ranked journals are high quality before you even begin to read the journal article.
When judging the quality of a research article using external indicators, the bottom line is to look at it from as many different perspectives as possible, including the author�s credentials, the author�s professional affiliation, and where the work is published.
FIGURE 8.2 | Criminal Justice and Criminology Journal Rankings by Impact Factor�2011
RESEARCH IN THE NEWS
Are Parents Creating Einsteins or Homer Simpsons?19
In a 2007 study on the effects of popular videos such as the �Baby Einstein� and �Brainy Baby� series, researchers found that these products may be doing more harm than good and may actually delay language development in toddlers. Parents aiming to put their babies on the fast track, even if they are still working on walking, spend hundreds of millions of dollars each year on the videos.
The study was conducted by researchers from the University of Washington. The data was obtained through telephone interviews with 1,008 parents of children age 2 months to 24 months. Each telephone interview took about 45 minutes to complete. Questions were asked about child and parent demographics, child-parent interactions, and child�s viewing of several content types of television and DVDs/videos. Parents were also asked to complete the short form of the MacArthur-Bates Communicative Development Inventory (CDI), which measures infant language development and has been shown to be both reliable and valid. The associations between CDI scores and media exposure were evaluated using multivariate regression (see Chapter 9), controlling for parent and child demographics and parent-child interactions.20 Among infants (age 8 to 16 months), each hour per day of viewing baby DVDs/videos was associated with a 17-point decrease in the CDI score. Infants who watched videos learned six to eight fewer new vocabulary words than babies who never watched the videos. Among toddlers (age 17 to 24 months), there were no significant associations between any type of media exposure and CDI scores.21 In fact, the American Academy of Pediatrics has recommended no television for children under 24 months.
The University of Washington press release22 regarding the study led to a letter from Bob Iger, the CEO of Disney and proprietor of Baby Einstein, to Mark Emmert, the president of the University of Washington, calling the press statement �misleading, irresponsible, and derogatory�23 and claiming the �methodology [used in the study] is doubtful, its data seem anomalous and the inferences it posits unreliable.�24 In response, President Emmert stated �The Journal of Pediatrics is a prestigious, peer-reviewed journal. Papers submitted to this journal undergo a rigorous review by experts in the field before they are accepted for publication. This process ensures that the work represented in the paper meets high standards of scientific inquiry required by the editors of the journal and its editorial panel of distinguished scientists�. The University of Washington will not retract its news release.�25
Internal Indicators of Research Quality
Although the external indicators of research quality serve as a quick screening mechanism for research articles, it is not a substitute for a detailed, internal review of the article. Even though many journals utilize a peer-review process and some have low manuscript acceptance rates, articles within those journals will vary in quality, so an internal assessment of research quality is essential. A reader who critically assesses a research article will evaluate the methodology used by the researcher, assess the analysis performed, and verify that the conclusions drawn by the authors are supported by the research findings. When we reviewed the structure of research articles earlier in the chapter, we provided evaluative questions you should ask about the title, abstract, introduction, literature review, results, discussion, conclusion, and references. We did not provide any evaluative questions for the methods section at the time, but now we�re ready to address those in this section, in which the internal indicators of research quality will be presented. These indicators will assist in answering the question �How good is this research article?� We will focus on the methods section of the article.
Throughout this book you have been provided with the tools necessary to critically evaluate research. We have covered a comprehensive list of research methods topics and have consistently discussed issues and challenges faced by researchers when conducting research. For example, in Chapter 3 we discussed probability and non-probability sampling and the issues of representativeness, generalizability, sampling error, and sample size. In Chapter 4, we discussed surveys and issues such as nonresponse, social desirability, ensuring truthful responses, and ensuring consistent question meaning for all respondents. We also provided a comprehensive discussion of reliability and validity, focusing on mechanisms to assess and increase each. In Chapter 5, we discussed experimental and quasi-experimental designs, focusing on the critical importance of the pretest, control group, and random assignment. In addition, we discussed several threats to internal validity that may impact the results found utilizing these designs. In Chapter 6, we discussed field research and the issues of going native, reactivity and the Hawthorne Effect, maintaining objectivity, and ethical dilemmas faced by field researchers. We also discussed case studies and the issues of generalizability and researcher bias. In Chapter 7, we discussed unobtrusive measures, such as secondary data analysis and the issues of having no control over the original data collection and problems with the validity of agency records. We also discussed the use of archival data and the reliability and validity issues that arise from this method, along with content analysis and the challenge of interrater reliability.
At this point, you may be thinking that no piece of research is going to withstand the rigors set forth in this chapter and book. We have stated it before, but it should be clear after the last paragraph that there is no perfect research. Researchers make a series of decisions when conducting a research study and not everyone will agree with those decisions. Each decision creates the potential for error, and each step in the research process creates the potential for error as well. There is plenty of high-quality research, though. The issue is not whether the research has limitations but how the flaws impact the research results. Are the errors of the magnitude that they can significantly impact the results of the study, which then leads you to question the results?
Your ability to read and critically evaluate research articles will improve with practice by reading many journal articles, books, and reports, but it does take practice. Remember, research involves a process and research articles are structured in a similar manner each time. Once you are comfortable with the process for conducting research and the structure of research articles, your review of articles will become easier and more routine. Once you have developed your ability to critically assess research articles, those skills will remain with you forever. You will not have to relearn the research process and evaluative issues every five years in order to maintain your skills. The reality is research methods do not change that much. Yes, it is true that new techniques are developed (e.g., Internet and e-mail surveys), but the foundation of research methods developed decades ago will be the same foundation in 100 years.
We will present several evaluative questions next. As you put your research methods knowledge into practice and review research articles, revisit the earlier chapters. But, do not think of research quality as a dichotomy of good and bad. In reality, research quality should be reflected as a continuum, and every research article can be placed somewhere on the continuum.
Questions to Ask about Research Articles
Following are some evaluative questions you should ask about a research article. Some of the questions will differentially apply, depending on the methods used in the research study. The questions will be categorized by chapter so you can easily refer back to the chapter for additional information.
Evaluative Questions from Chapter 2 Material�Ethics and Terminology
What is/are the basic research question(s)?
What were the major concepts in the research study?
How were the concepts operationalized and measured?
Would other measurements have been better? Why or why not?
What were the independent and dependent variables in the study?
Were any hypotheses stated?
Were these hypotheses justified adequately in terms of prior research?
Did the study seem consistent with current ethical standards? Explain how ethical standards were upheld.
Did the author adequately represent the findings in the discussion and/or conclusions sections?
Did the researcher overgeneralize the findings? If yes, how?
Evaluative Questions from Chapter 3 Material-Sampling In the methods section of a research article, the researcher should describe the sampling procedures used in the study and describe the subjects who participated in the research. When you are reading about the sampling procedures, be sure to evaluate who the research subjects were, taking into account available demographic characteristics such as age, race, ethnicity, and gender. Be sure to assess whether the composition of the sample will limit the generalizability of the results. Some evaluative questions about sampling follow.
Was a sample or the entire population used in the study?
What type of sampling method was employed?
Was a probability sampling method used?
If a non-probability sampling method was used, does the researcher justify its use and discuss its limitations?
Did the authors think the sample was generally representative of the population from which it was drawn? Why or why not?
Do you think the sample was generally representative of the population from which it was drawn? Why or why not?
Was the sample size large enough? Why or why not?
Overall, is the sample appropriate for generalizing to the population?
Evaluative Questions from Chapter 4 Material�Surveys, Validity, and Reliability
Was survey research used? Was this design suited to the research question posed? Why or why not?
Was the response rate reported? If yes, what was it?
Does it appear likely that those who did not respond or participate were markedly different from those who did participate? Why or why not?
What is the likelihood that characteristics of the nonrespondents introduced bias into the results? Did the authors adequately discuss this issue?
What evidence did the authors provide to show the representativeness/generalizability of the sample to the population? What comparisons between the respondents, sample, and population were presented?
Did the survey used, the measures of the variables, seem valid and reliable? Why or why not?
How did the author attempt to establish the validity of the survey?
When delving into sensitive matters (e.g., past victimization or criminal/delinquent history), is there reason to believe that accurate data were obtained?
Do you believe that social desirability is an issue in the study? Why or why not?
How did the author attempt to establish the reliability of the survey?
If an index was used in the survey, does it have adequate internal consistency?
How did the researcher ensure consistent meaning of the questions?
How was the survey distributed? What factors influenced the author�s decision to distribute the survey in this manner?
Evaluative Questions from Chapter 5 Material�Experimental and Quasi-Experimental Designs
What type of research design was used in this study?
What were the parameters/criteria for inclusion in the study?
What cases were excluded from the study?
What was/were the treatment(s)?
What was/were the dependent variable(s)?
What pre-test(s) was/were conducted? Be sure to discuss how each dependent variable was measured and the time frame.
What post-test(s) was/were conducted? Be sure to discuss how each dependent variable was measured and the time frame.
What was/were the experimental/treatment group(s)?
What was/were the control/comparison group(s)? Was the control/comparison group adequate?
Were the groups established through randomization or matching? Be sure to discuss the procedures used to establish and monitor equivalence.
What threats to internal validity could impact the results of this study? For each threat to internal validity identified, define the threat, describe how it applies to this study, and explain how it could impact the results of this study.
Were any causal assertions made or implied in the hypotheses or in subsequent discussion? If yes, were all three criteria for establishing causal relationships addressed? How did the author establish the existence of the three criteria for causality? What, if any, variables were controlled in the analysis to reduce the risk of spurious relationships?
Evaluative Questions from Chapter 6 Material�Field Research and Case Studies
Was field research or a case study used in this study? Was the design suited to the research question posed? Why or why not?
How much interaction was present between the researcher and the research subjects?
What steps were taken to keep the researcher from influencing the behavior of the research subjects?
Were any ethical dilemmas faced by the researcher? If yes, how did the researcher handle the dilemmas?
Did the researcher maintain objectivity? If not, how did this influence the results of the study?
Did the researcher acknowledge any biases or reactivity in the study? If so, how did they impact the results?
Did the researcher discuss the generalizability of the findings?
Did the instruments used, the measures of the variables, seem valid and reliable? Why or why not?
How did the author attempt to establish the reliability of the measurement?
How did the author attempt to establish the validity of the measurement?
What more could have been done in the study to establish reliability and validity?
Evaluative Questions from Chapter 7 Material�Unobtrusive Methods
Was an unobtrusive method such as secondary data analysis used? Was this design suited to the research question posed? Why or why not?
Did the instruments used, the measures of the variables, seem valid and reliable? Why or why not?
How did the author attempt to establish the reliability of the measurement?
How did the author attempt to establish the validity of the measurement?
What more could have been done in the study to establish reliability and validity?
CLASSICS IN CJ RESEARCH
Factors that Influence Police Decisions Regarding Juveniles
Research Study26
In the mid-1960s, very few research studies had been conducted on police discretion. The use of police discretion was recognized by researchers and law enforcement personnel at the time, but few studies had addressed the factors that police consider when making decisions to arrest. Piliavin and Briar were the first to assess the factors that impact police decisions regarding juveniles.
Research Question
What factors influence police decisions regarding juveniles?
Methodology
The setting for the research was a metropolitan police department in the United States serving an industrial city with approximately 450,000 residents. Data for this study came from observations of police officers on the street over a 9-month period and interviews with these same officers (27 of the 30 officers were interviewed). Utilizing field research, systematic data were collected on police encounters with 76 juveniles. Observations took place on a variety of days and shifts, but more observations occurred in the evenings and on weekends when police officers were more likely to interact with juveniles.
The subjects under study were 30 police officers assigned to the Juvenile Bureau. These police officers were responsible for delinquency prevention as well as law enforcement for the police department. In the field, juvenile officers operated essentially as patrol officers. They were assigned to beats, answered calls for service, and although concerned primarily with juvenile offenders, frequently had occasion to arrest adults. The study is limited to police interaction with juveniles though. The researchers had an opportunity to observe all officers in the Bureau during the study, but their observations were concentrated on those who had been working in the Bureau for a minimum of one year. The officers were observed in the course of their regular patrol shifts. Observations were completed for the following encounters with juveniles:
1. Encounters taking place at or near the scene of offenses reported to the police department; and
2. Encounters occurring as the result of officers� directly observing youths either committing offenses or in suspicious circumstances.
For these encounters, officers could choose among five dispositional alternatives:
1. Outright release;
2. Release and submission of a field interrogation report briefly describing the circumstances surrounding the police-juvenile encounter;
3. Official reprimand and release to parents or guardian;
4. Citation to juvenile court; and
5. Arrest and confinement in juvenile detention.
Dispositions 3, 4, and 5 involved the juvenile being taken to the police station and resulted in an official record for the juvenile because his name was officially recorded in Bureau files as a juvenile violator.
For purposes of this analysis, each youth�s demeanor in the encounter was classified as either cooperative or uncooperative. The data used for the classification of demeanor were the written records of observations made by the researchers. The classifications were made by an independent assessor not associated with this study. In classifying a youth�s demeanor as cooperative or uncooperative, particular attention was paid to: 1) the youth�s responses to police officers� questions and requests; 2) the respect and deference, or lack of these qualities, shown by the youth toward police officers, and 3) police officers assessments of the youth�s demeanor.
Results
The researchers reported several results. First, the researchers found that broad discretion was exercised by police officers in dealing with juvenile offenders. All offenses, even serious ones, received each of the five dispositional alternatives previously discussed. Therefore, the commission of a serious offense did not automatically result in arrest.
Second, the exercise of discretion was affected by a few readily observable criteria, including the seriousness of the current offense, the juveniles� prior offense record, race, and demeanor. The first two criteria (i.e., seriousness of offense and prior record) are legal factors and are expected to be taken into consideration by the police when making decisions.
However, the demeanor of the youth was identified as a major factor in determining what police disposition he would be given. Overall, 67% of the juveniles who were categorized as uncooperative in their interaction with police were arrested while less than 5% of the juveniles who were deemed cooperative were arrested. During interviews, officers estimated that 50�60% of dispositions for first-time juvenile offenders were based on the demeanor of the juvenile. Besides legal factors like seriousness of the offense and prior record, demeanor of the juvenile was the most important factor influencing the decisions of officers.
Third, the differential in arrest and apprehension rates between blacks and whites was not simply a consequence of a greater offense rate among blacks. To some extent, the differential was due to the fact that blacks more often than whites were viewed as uncooperative. Blacks were more likely to receive one of the more severe outcomes. This finding was attributed to police officer prejudice against blacks. Researchers interviewed 27 of the officers assigned to the Juvenile Bureau, and 18 of them candidly expressed their disapproval of blacks.
Limitations with the Study Procedure
Piliavin and Briar offered one of the first empirical studies of police discretion by observing police encounters with juveniles. They based their conclusions, however, on a small sample of police observations (i.e., 76 total observations were made in a 9-month period). Also, the 76 observations were not randomly selected. These limitations, small sample size and non-random sample, bring the generalizability of the findings into question. What the researchers observed in this particular city with these officers may not apply in other jurisdictions with different officers.
There are possible reliability issues with how demeanor was coded for the research. Whether or not the juvenile was cooperative and respectful to the police could be a highly subjective decision. The researchers did use an independent assessor to categorize the data on demeanor, but the assessor�s interpretation of the data may have been different from another person�s interpretation. Utilizing an interrater reliability protocol where two independent assessors categorize the data on demeanor and then the two assessments are compared would have improved the reliability of the categorization.
In Piliavin and Briar�s study, the researchers� role of observer as participant (discussed in Chapter 6) was known to the police officers being studied. The police knew exactly who the researchers were and that their encounters with juveniles were being examined. A potential source of bias with this type of observational research is known as the Hawthorne Effect (see Chapter 6). When research subjects are aware that their behavior is being observed, the observation itself may influence their behavior. The extent to which the police officers in Piliavin and Briar�s study altered their behavior because they were being observed was unknown. However, the candor shown by the officers in their interviews with the investigators and the use of officially frowned-upon practices while under observation provide some assurance that the observations were valid and reflected the typical activities of the police officers studied.
Impact on Criminal Justice
Piliavin and Briar were among the first to conduct an empirical study that explored the influence of demeanor on police decision-making. Their systematic observations of police-juvenile encounters revealed that the police were more likely to arrest uncooperative juveniles. Over the past half century, numerous studies of police discretion have demonstrated the relationship between suspect demeanor and arrest. Piliavin and Briar also observed that police unfairly targeted black juveniles because they fit a stereotype held by the police that most delinquents were black. Today, the influence of race and police discretion centers on the topic of racial profiling as discussed in the chapter opening case study.
Article Critique: Minneapolis Domestic Violence Experiment
Sherman, Lawrence W., and Richard A. Berk. (1984). �The specific deterrent effects of arrest for domestic assault.� American Sociological Review. 49, 261�272. Portions of the article are included in Appendix A.
As the final section in this chapter, we will present an example of an article critique utilizing the internal indicators of research quality discussed in the previous section. Recall that it is impossible to develop a single checklist of the topics that need to be addressed in a methods section of a research article, because the details that need to be provided depend on the methods used. Similarly, it is impossible to develop a single set of questions that can be asked and answered to comprehensively assess every research article, because the questions depend on the methods used in the article. Therefore, we will present an example of an article critique tailored to the experimental and quasi-experimental designs discussed in Chapter 5. We selected the Minneapolis Domestic Violence Experiment (MDVE) as the example, because it is probably the best known piece of research in criminal justice and criminology. You not only hear about the results of the MDVE (arrest is most effective in reducing domestic violence recidivism) in research methods, but also hear about it in policing classes and policy courses. The MDVE is to research methods what Miranda v. Arizona is to criminal procedure: the most recognized example on the topic.
Next, we ask and answer several questions regarding the MDVE. Portions of the article are in Appendix A. You can review the article to see where we obtained the information to answer each question. This is the type of activity you will be able to perform, although probably not as structured as the questions and answers that follow, as you begin to apply your knowledge as an educated consumer of research.
1. In one sentence, state the purpose of this study.
The purpose of the MDVE was to determine which of three police responses (arrest, separation, or mediation) produced the lowest recidivism rates for domestic violence offenders.
2. What type of research design was used in this study?
A randomized experimental design was used in the MDVE.
3. What were the parameters/criteria for inclusion in the study?
In order to be included in the study, the calls for police service had to involve a misdemeanor (simple) domestic assault, and both the suspect and the victim had to be present when the police arrived.
4. What cases were excluded from the study?
The following cases were excluded from the study: (1) cases involving felony domestic assaults; (2) cases where both parties were not present when the police arrived; (3) cases where the suspect attempted to assault police officers; (4) cases where a victim persistently demanded an arrest, and (5) cases involving injuries to both parties.
5. What was/were the treatments)?
The treatment was the police response to domestic violence, which included arrest, separation, or mediation.
6. What was/were the dependent variable(s)?
The dependent variable was repeat domestic violence (i.e., recidivism).
7. What pre-test(s) was/were conducted? Be sure to discuss how each dependent variable was measured and the time frame.
Since the dependent variable was recidivism, no pre-test was conducted in the MDVE.
8. What post-test(s) was/were conducted? Be sure to discuss how each dependent variable was measured and the time frame.
The post-test involved a 6-month follow-up period to measure the frequency and seriousness of domestic violence after each police intervention of arrest, separation, or mediation. The dependent variable (i.e., repeat domestic violence) was measured in two ways. First, the researchers obtained police offense and arrest reports for domestic violence that mentioned the suspect�s name during the 6-month follow-up period. Second, victim interviews were completed 2 weeks after the police intervention and every 2 weeks thereafter for 24 weeks. The first victim interview was face-to-face while each subsequent interview was conducted over the telephone. The victim interviews allowed researchers to examine domestic violence offenses that may have occurred but did not come to the official attention of police.
9. What was/were the experimental group(s)?
Since three interventions were used in the MDVE, there are three different groups of people, totaling 314 cases. There were two experimental groups. First, the 136 people arrested during the study comprised one experimental group. Second, the 89 people separated during the study comprised the second experimental group.
10. What was/were the control group(s)?
Since the common police practice at the time for cases of misdemeanor domestic violence was to advise and mediate the situation, leaving both parties at the location, the control group was the 89 people advised/mediated during the domestic violence calls for service.
11. How was random assignment established? Be sure to discuss the procedures used to establish and monitor equivalence.
The three different police actions were randomly distributed based on color-coded report forms carried by the officers. Upon a misdemeanor domestic violence call with both parties present, the officer�s action (arrest, separation, or mediation) was predetermined by the order of report forms in the officer�s notebook. The colored report forms were randomly ordered in the officer�s notebook and the color on the form determined the officer response at the scene. All colored report forms were randomly ordered through a lottery assignment method. The result was that all police officer actions in misdemeanor domestic violence calls were randomly assigned. To ensure the random assignment was carried out as planned, research staff participated in ride-alongs with officers to ensure that officers did not skip the order of randomly ordered forms. In addition, the research staff logged the domestic violence reports in the order received to make sure the sequence corresponded to the original assignment of police interventions. Table 1 in the research article located in Appendix A shows the degree to which the treatments were delivered as designed.
12. Identify two threats to internal validity that may impact the results of this study. For each threat to internal validity identified, define the threat, describe how it applies to this study, and explain how it may impact the results of this study.
The first threat to internal validity is selection bias. As depicted in Table 1 in the article in Appendix A, the officers did not always follow the random assignment protocol. For example, some officers decided to violate the random assignment protocol, which violated the randomized experimental design, because they found the upcoming treatment inappropriate for the situation. The officers did not always follow the randomly assigned action (arrest, separation, or mediation) as a result of other circumstances that occurred at the scene. In fact, some officers simply ignored the assigned action if they felt a particular call for domestic violence required another action. Selection bias generally indicates that the experimental group is somehow different from the control group on a factor that could influence the post-test results. Since the officers violated the random assignment protocol and self-selected some subjects for arrest, the arrested group may be different from the other two groups on factors that may impact repeat domestic violence.
The second threat to internal validity is attrition or subject mortality. Attrition refers to differential loss in the number or type of subjects between the experimental and control groups. In the MDVE, attrition occurred with the victim interviews. Only 205 of the victims (65% response rate) could be located and initial interviews obtained two weeks after the police intervention. Only 161 victims (51% response rate) provided all 12 follow-up interviews over the 6-month follow-up period. The question then is, �Are there differences between the respondents and the nonrespondents that could then impact the results of the MDVE?� We do not know how the two groups differed so are unable to adequately answer the question. We do know from Chapter 4 that as the response rate decreases, it becomes more likely that the nonrespondents will differ from the survey respondents. When there are significant differences between respondents and nonrespondents, each group represents biased subgroups of the total population. Bias means that in some systematic way the individuals responding to a survey are different from the overall population. Therefore, the results based on the survey respondents are not reflective of the overall population.
Chapter Summary
In this chapter, we reviewed the steps in the research process to provide the �big picture� of research endeavors. We also reviewed the structure of research articles. It is helpful as an educated consumer of research to understand the common structure of research articles and reports. You will be able to easily identify these sections as you review research articles and reports in the future. We specifically discussed three external indicators of research quality, including researcher reputation, institutional reputation, and journal quality. The external indicators can serve as a short-cut method to determine if the research article is worth further attention and assessment. Although the external indicators of research quality serve as a quick screening mechanism for research articles, it is not a substitute for a detailed, internal review of the article. A reader who critically assesses a research article will evaluate the methodology used by the researcher, assess the analysis performed, and verify that the conclusions drawn by the authors are supported by the research findings. We reviewed the internal indicators of research quality in this chapter. The discussion was a culmination of the tools provided throughout this book to critically evaluate research. Finally, this chapter provided an example of a research article critique to demonstrate how the internal indicators of research quality can be used to assess a research article. Now that you have finished this chapter, you have the tools necessary to thoroughly review and evaluate research, with one exception: statistics. Statistics will be covered in the next chapter.
Critical Thinking Questions
1. What are the steps in the research process, and what activities occur at each step?
2. What are the primary sections of a research article, and what material is covered in each section?
3. What are the three main external indicators of research quality? How is journal quality determined?
4. How would you apply the internal indicators of research quality to a research article? Be sure to provide the types of questions you would ask in your assessment.
Endnotes
1 Grogger, Jeffrey, and Greg Ridgeway. (2006). �Testing for racial profiling in traffic stops from behind a veil of darkness.� Journal of the American Statistical Association 101, 878�887.
2 Worden, Robert E., Sarah J. McLean, and Andrew R Wheeler. (2012). �Testing for racial profiling with the veil-of-darkness method.� Police Quarterly 15, 92�111.
3 Ibid.
4 Hamermesh, D. S. (1996). Workdays, workhours, and work schedules: Evidence for the United States and Germany. Kalamazoo, MI: W. E. Upjohn Institute for Employment Research.
5 Worden, et al., 2012.
6 http://www.racialprofilinganalysis.neu.edu/background/jurisdictions.php. Retrieved on July 28, 2012.
7 Ibid.
8 Worden, et al., 2012.
9 http://www.forbes.com/sites/jacquelynsmith/2012/07/20/how-road-rage-endangers-your-commute-and-how-to-prevent-it-in-yourself/; http://www.careerbuilder.com/share/aboutus/pressreleasesdetail.aspx?sd=7/l8/2012&id=pr708&ed=12/31/2012
10 Pyrczak, Fred. (2008). Evaluating research in academic journals: A practical guide to realistic evaluation. Glendale, CA: Pyrczak Publishing.
11 Ibid.
12 McReynolds, Larkin S., and Jeffrey C. Sandler. (2012). �Evaluating New York State�s Sex Offender Management and Treatment Act: A matched historical cohort analysis.� Criminal Justice Policy Review 23, 164�185.
13 Sandler, J. C., N. J. Freeman, and K. M. Socia. (2008). �Does a watched pot boil? A time-series analysis of New York State�s sex offender registration and notification.� Psychology, Public Policy, and Law 14, 284�302; Zgoba, K., P. Witt, M. Dalessandro, and B. Veysey. (2008). Meghan�s Law: Assessing the practical and monetary efficacy. Washington, D.C.: U.S. Department of Justice.
14 Duwe, G., W. Donnay, and R. Tewksbury. (2008). �Does residential proximity matter? A geographic analysis of sex offense recidivism.� Criminal Justice and Behavior 35, 484�504.
15 Pyrczak, 2008.
16 Ibid.
17 Ibid.
18 Ibid.
19 Dance, Amber. (August 7, 2007). �Videos as a baby brain drain: A study finds infants who view some popular educational products learn fewer words.� Los Angeles Times. http://articles.latimes.com/2007/aug/07/science/sci-babyeinstein7. Retrieved on July 28, 2012; Park, Alice. (August 6, 2007). �Baby Einsteins: Not so smart after all.� Time Science. http://www.time.com/time/health/article/0,8599,1650352,00.html. Retrieved on July 28, 2012.
20 Zimmerman, Frederick J., Dimitri A. Christakis, & Andrew N. Meltzoff. (2007). �Associations between media viewing and language development in children under age 2 years.� Journal of Pediatrics 151, 364�368.
21 Ibid.
22 http://www.washington.edu/alumni/uwnewslinks/200709/videos.html. Retrieved on July 28, 2012.
23 http://www.seattlepi.com/local/article/The-full-text-of-Walt-Disney-Co-s-letter-1246455.php. Retrieved on July 28, 2012.
24 Ibid.
25 uwnews.washington.edu/ni/article.asp?articleID=36148. Retrieved on July 28, 2012.
26 Piliavin, Irving, and Scott Briar. (1964). �Police encounters with juveniles.� American Journal of Sociology 70, 206�214. This study was also included in Amy B. Thistlethwaite and John D. Wooldredge. (2010). Forty studies that changed criminal justice: Explorations into the history of criminal justice research. Upper Saddle River, NJ: Prentice Hall.
