
4 Chapter 4: Survey Research
CASE STUDY: National Crime Victimization Survey
Criminal Victimization in the United States1
How many violent and property crime victimizations occurred in the United States in 2010?
The results of the National Crime Victimization Survey (NCVS) are provided on an annual basis by the U.S. Census Bureau and serve as an alternative to the Uniform Crime Reports. The NCVS collects information on the violent crimes of rape or sexual assault, robbery, aggravated assault, and simple assault, and the property crimes of household burglary, motor vehicle theft, and theft. The results are derived from a nationally representative sample of U.S. households selected through a stratified, multistage cluster sampling process (see Chapter 3). The survey results are based on data gathered from residents living throughout the United States, including persons living in group quarters, such as dormitories, rooming houses, and religious group dwellings. Armed Forces personnel living in military barracks and institutionalized persons, such as prison inmates, are not included in the survey.
Each housing unit selected for the NCVS remains in the sample for 3 years, with each of the seven interviews taking place at 6-month intervals. An NCVS interviewer’s first contact with a household selected for the survey is in person and the survey is completed through a face-to-face interview. The interviewer may conduct subsequent interviews by telephone. To elicit more accurate reporting of incidents, the NCVS uses a self-report method that includes a direct interview with each person 12 years or older in the household. In 2010, 40,974 households and 73,283 individuals age 12 and older were interviewed for the NCVS. Each household was interviewed twice during the year. The response rate was 92.3% of households and 87.5% of eligible individuals.
The NCVS has been collecting data on personal and household victimization since 1973. The data include type of crime, month, time and location of the crime, relationship between victim and offender, characteristics of the offender, self-protective actions taken by the victim during the incident and results of those actions, consequences of the victimization, type of property lost, whether the crime was reported to the police and reasons for reporting or not reporting, and offender use of weapons, drugs, and alcohol. Basic demographic information such as age, race, gender, and income is also collected to enable analysis of victimization by various subpopulations.
During 2010, U.S. residents age 12 or older experienced an estimated 18.7 million violent and property crime victimizations, down from 20.1 million in 2009 and 24.2 million in 2001. The criminal victimizations in 2010 included an estimated 3.8 million violent victimizations and 14.8 million property victimizations. Violent and serious violent victimizations (includes rape or sexual assault, robbery, and aggravated assault) declined by nearly 34% between 2001 and 2010.
From 2001 to 2010, weapon violence (26% to 22%) and stranger-perpetrated violence (44% to 39%) declined. Between 2001 and 2010, about 6% to 9% of all violent victimizations were committed with firearms. This percentage has remained stable since 2004. The percentage of victims of violent crimes who suffered an injury during the victimization increased from 24% in 2008 to 29% in 2010. About 50% of all violent victimizations and nearly 40% of property crimes were reported to the police in 2010. These percentages have remained stable over the past 10 years. Males (15.7 per 1,000 population) and females (14.2 per 1,000 population) had similar rates of violent victimization during 2010.
Limitations with the Study Procedure
While rape or sexual assault significantly increased from 2009 to 2010, you should be cautious in interpreting this change because the estimates of rape/sexual assault are based on a small number of cases reported to the interviewers. Small changes in the number of victimizations can result in large year-to-year percentage changes. For instance, the 2010 estimate of rape or sexual assault is based on 57 reported cases compared to 36 reported cases in 2009. This represents an increase of 21 actual cases but also represents a 49.6% increase in the national estimate of rape or sexual assault from 2009 to 2010. The measurement of rape or sexual assault represents one of the most serious challenges in the field of victimization research. Rape and sexual assault remain sensitive subjects that are difficult to ask about in the survey context.
Any time national estimates are derived from a sample rather than the entire population, as is the case with the NCVS, because of sampling error it is important to be cautious when drawing conclusions about the size of one population estimate in comparison to another (e.g., does aggravated assault occur more frequently than robbery?) or about whether population estimates are changing over time (e.g., did robbery increase or decrease in the past year?). Although one figure may be larger than another, the NCVS estimates are based on responses from a sample of the population. Therefore, each estimate has some degree of sampling error. The sampling error of a population estimate depends on several factors, including the amount of variation in the responses, the size and representativeness of the sample, and the size of the subgroup for which the estimate is computed, as illustrated in the rape or sexual assault example previously discussed.
In addition to sampling error, the NCVS results are subject to non-sampling error. While substantial care is taken in the NCVS to reduce the sources of non-sampling error throughout all the survey operations, an unknown amount of non-sampling error still remains. A major source of non-sampling error includes the inability of the respondents to recall in detail the crimes that occurred during the six months prior to the interview. The NCVS uses a 6-month reference period. Respondents are asked to report victimization experiences occurring in the last 6 months. Generally, respondents are able to recall more accurately an event that occurred within 3 months of the interview rather than one that occurred within 6 months. Research indicates that assault is recalled with the least accuracy of any crime measured by the NCVS. This may be related to the tendency of victims to not report crimes committed by offenders who are not strangers, especially if they are relatives. Recall problems may result in an understatement of the actual rate of assault.
However, a shorter reference period would require more field interviews per year, increasing the data collection costs significantly. These increased costs would have to be balanced by cost reductions elsewhere (sample size is often considered). Reducing sample size however, reduces the precision of estimates of relatively rare crimes such as rape or sexual assault. In light of these trade-offs of cost and precision, a reference period of 6 months is used for the NCVS.
Other sources of non-sampling error can result from other types of response mistakes, including errors in reporting incidents as crimes, misclassification of crimes, systematic data errors introduced by the interviewer, and errors made in coding and processing the data.
The NCVS is one of the two national sources of crime data in the United States. The NCVS is generally viewed as a more reliable and valid measure of crime than the Uniform Crime Reports. The data from the NCVS survey are particularly useful for calculating crime rates, both aggregated and disaggregated, and for determining changes in crime rates from year to year. In addition, the NCVS is the primary source of information on the characteristics of criminal victimization and on the number and types of crimes not reported to law enforcement authorities. It provides the largest national forum for victims to describe the impact of crime and the characteristics of violent offenders.
In This Chapter You Will Learn
Why nonresponse is a major source of survey error and how nonresponse impacts survey results
The four main mechanisms for assessing validity as well as how to increase the validity of survey questions and responses
How to assess the reliability of survey questions and responses as well as ways to increase reliability
The methods in which surveys are distributed and the strengths and weaknesses of each
Introduction
Survey research involves the collection of information from individuals through their responses to questions, and represents one of the most widely used research tools in crime and criminal justice studies. Surveys are one of the most common ways to obtain information about attitudes and behaviors and involve collecting information from people via self-administered surveys, telephone interviews, face-to-face interviews, and more recently Internet and e-mail–based surveys.
In survey research, the main way of collecting information is by asking people questions. Their answers constitute the data to be analyzed. For example, the U.S. Census is a self-administered survey where individuals receive surveys in the mail and are asked to fill them out and send them back to the U.S. Census Bureau. In addition to the counting of people, the U.S. Census collects data about the race, age, household composition, education, type of housing, and many other characteristics of the people counted. As presented in the introductory case study, the NCVS is another example of a large-scale survey where data is collected via face-to-face and telephone interviews.
Most people are familiar with surveys, especially those that involve the measurement of public opinion for newspaper and magazine articles, the measurement of political perceptions and opinions involving politicians, and marketing research designed to understand consumer preferences and interests. In fact, we are inundated with surveys in our daily lives. From the restaurant that offers you a free appetizer on a future visit for completing a telephone survey about your experience, to the call center that wants your feedback on the performance of the customer service representative at the conclusion of your phone call, to solicitations to complete online surveys regarding your website experience, to the evaluation of your professor at the end of the semester, we don’t have to look far for an example of a survey in our daily lives.
The same is true for research in criminology and criminal justice. Surveys are frequently the data collection method of choice to answer research questions. For example, if we want to know whether the police officers in our local police department prefer to work 8-, 10-, or 12-hour shifts, we can survey them to address this issue. If we want to determine the level of fear of crime on a college campus, we can survey students, faculty, staff, and visitors to gauge their level of fear of crime. If we want to know if the public agrees with recent U.S. Supreme Court decisions, we can survey residents and ask them their opinion. If we want to understand how correctional officers view their roles and interactions with inmates, we can survey the officers regarding the topic. If we want to identify the extent, causes, and consequences of bullying, we can survey students to better understand bullying. Overall, surveys can be used to answer a wide range of research questions involving crime and the operation of the criminal justice system.
Three characteristics of surveys make them a preferable source of data collection in comparison to other sources.2 First, probability sampling is typically used in surveys, which enables the research consumer to have confidence that the sample is not a biased one and is a reflection of the larger population. Data from research studies using a probability sample are definitely preferred over data from a non-probability sample, such as those who attend a college class or happen to be convenient to survey. Second, standardized measurement (i.e., each respondent is asked the same questions in the same manner) ensures that comparable information is obtained about everyone who responds to the survey. Standardized measurement produces meaningful statistics and comparisons of respondents (e.g., how are juveniles who are chronically truant different from juveniles who are not?). Third, the development of a survey ensures that all the data needed for a given analysis are available. For example, you may find in your literature that parental supervision is an important factor that distinguishes truants from nontruants. Since you are creating the survey, you can be sure to ask questions about the respondent’s level of parental supervision so the relationship between truancy and parental supervision can be addressed in your study.
Survey Components
Surveys bring together sampling, question design, and methods of survey distribution. It is important to note that each of these activities has many applications outside of surveys, but their presence is essential to quality surveys. For consumers of research, it is important to understand how the details of each component of a survey can affect its precision, consistency, and accuracy (i.e., its reliability and validity). How the sample is selected, which questions are asked, and the procedures used to collect the answers all impact the quality of the survey and its results.3
Sampling With the U.S. Census as an exception, survey information is typically collected from a sample of the population, rather than from every member of the population. The ability to select a sample that is representative of the whole population was a significant development that made surveys a useful research tool. The keys to good sampling are finding a way to give all (or nearly all) members of the population the same (or a known) chance of being selected and using probability sampling methods for choosing the sample.4
Every survey involves a number of decisions that have the potential to enhance or detract from the accuracy of the survey results. With respect to sampling, critical issues include the following: the choice of whether or not to use a probability sample, the size of the sample, the sampling technique utilized, and the rate of response (the percentage of those sampled who respond to the survey). Since sampling was covered in detail in Chapter 3, it will not be revisited in this chapter. At this point, realize that probability sampling techniques are typically used in surveys. Therefore, the material covered in Chapter 3 is applicable to survey development and distribution. This chapter will discuss the response rate for surveys since it directly applies to surveys and was not covered in Chapter 3.
Survey Question Design In surveys, the questions measure the concepts and variables under study. Survey question design is a critical element of survey research. Sticking with the theme of this book regarding the development of educated consumers of research, the focus on question design in this chapter will not be on how to write survey questions but on strategies for evaluating the quality of the questions. Survey researchers evaluate questions to find out if they are well understood by the respondents and if the answers are meaningful. In other words, the reliability and validity of the survey questions must be assessed in determining the quality of the survey. The researcher must decide the extent to which previous literature regarding the reliability and validity of questions will be drawn upon in the development of the survey as well as the process for question evaluation.
Methods of Survey Distribution Surveys can be distributed through several means, including face-to-face or telephone interviews or through self-administered means via the mail or Internet. Some surveys have respondents answer self-administered questions while others use an interviewer to ask questions and record answers. When interviewers are used, it is important to avoid having them influence the answers given by the respondents. The decision about which mode of data collection to use has important cost implications and affects the quality of the data that will be collected.5
The three components of survey development (i.e., sampling, question design, and methods of distribution) are interrelated because the quality of the survey data will not be better than the most error-prone feature of the survey design. A large sample size will not make up for a low rate of response. Similarly, a high response rate will not compensate for unreliable and invalid survey questions. Survey researchers must focus on each component of the survey, including sampling, question design, and method of distribution, because weaknesses in one area cannot be rectified by the strengths of another area.
Since sampling has already been covered in Chapter 3, this chapter discusses question design and methods of survey distribution. A concentrated effort is made to discuss the realities and the practical problems with the decisions made by survey researchers. The goal is to provide a comprehensive overview of the sources of error in surveys and the range of methodological issues that arise when using surveys. Although survey research is a common way to solicit information from a wide variety of individuals, it is not without its limitations, which will be discussed throughout this chapter. We begin our discussion with an overview of the sources of error in survey research.
Issues in Survey Development: Nonresponse and Survey Design
Sampling error, as discussed in Chapter 3, occurs because the sample drawn from a population will not exactly match the population. For example, survey results from a sample of citizens on attitudes toward the use of the death penalty will not be identical to the overall survey results if an entire state population of citizens was surveyed. As discussed in Chapter 3, the difference in survey results between a sample and a population is called sampling error. Researchers expect there to be a difference between the sample results and the results from an entire population, even when the sample is representative of the population. They just try to minimize the error as much as possible.
When a sample is drawn, it is inevitable that the sample will differ from the population from which it was drawn. The way the sample is drawn (e.g., probability vs. non-probability sampling) can affect how closely the sample is likely to mirror the characteristics of the population. Regardless of the sophistication of the sampling strategy, by chance, the sample will differ slightly from what it would look like if it was an exact mirror image of the population. One of the goals of survey research is to minimize the random, by chance differences between the sample and the population.
Nonresponse
Nonresponse is a major source of survey error. There are three categories of nonrespondents (i.e., those selected to be in a sample who do not actually respond to the survey)6:
1. Those who did not receive the survey, thereby not giving them a chance to respond to the survey. For example, this includes mailed surveys that are undeliverable due to bad addresses and telephone surveys that fail to call when the potential respondent is available to answer the phone.
2. Those who receive the survey but refuse to complete it. For example, this includes potential respondents who refuse to participate in the NCVS even though their household has been selected for participation. In 2010, 7.7% of the sampled households refused to participate in the survey.7
3. Those asked to participate in the survey but are unable to perform the task required of them. This includes people who are too ill to be interviewed, who have language barriers, or whose reading and writing skills preclude them from completing a self-administered survey.
Failure to collect survey data from a high percentage of those selected to be in a sample is a major source of survey error.8 When it comes to surveys, the quality of the results not only depends on how well the sample is a close approximation of the population but also how well those who respond to the survey reflect the total population. The method of distribution that a researcher decides to use can have a major influence on the response rate and the extent to which nonrespondents introduce bias into the results. As discussed later in this chapter, some methods of distribution (e.g., face-to-face interviews) have higher response rates than other distribution methods (e.g., mailed surveys). Overall, a low response rate will bias the sample, which means that the nonresponse makes the respondents systematically different from the population from which they were drawn, thereby producing biased results. For example, let’s say we surveyed 100 physicians on the effects of energy drinks on general health, and 50 returned the survey, for a response rate of 50%. The question we should consider is, “How do the 50% who did not respond differ from the 50% who did?” In this circumstance, if we had the other 50% of the responses, they might totally change the results of the study.
Calculating Response Rates In assessing the quality of a research project that used a survey to collect data, the response rate is a basic parameter for evaluating a project. Simply, the response rate is the number of people who respond to the survey divided by the number of people sampled. The denominator includes all people in the sample who were selected as a potential survey respondent but did not respond for whatever reason. This includes the three categories of nonrespondents previously listed, including those who do not receive the survey, those who receive the survey but refuse to participate, and those who are asked to participate in the survey but are unable to perform the task required of them.
Since the response rate is a simple way to assess the quality of a study involving a survey, researchers want to demonstrate a high response rate. To this end, some researchers do not include some of the categories of nonrespondents in the calculation of the response rate, which artificially inflates the response rate for the study. Most commonly, the category of nonrespondents that are excluded from the response rate calculation are those who did not receive the survey.
For example, let’s say that a sample of 1,000 college students has been selected for a survey, designed to be completed via telephone interviews, on criminal victimization on campus. In this fictitious study, 500 students completed the survey, 100 students refused to complete the survey and hung up on the interviewer, while another 400 never answered their phone despite numerous calls. What is the response rate? Based on the discussion above, the response rate is 50%. The response rate is the number of people who complete the survey (i.e., 500) divided by the number of people sampled (i.e., 1,000). However, some researchers will exclude the 400 potential respondents who were in the sample but never answered their phone despite repeated attempts. With this exclusion, the response rate is now 83.3%, which is much higher, and therefore better, because the researcher has only included those who completed the survey and those who refused to do so in the response rate (i.e., 500/600).
As an educated consumer of research, you need to be cautious when interpreting response rates. It is important to specifically know how the reported response rate was calculated. As illustrated in the example, differences in the way response rates are calculated can make comparisons across studies difficult. Instead of reporting a response rate, some researchers will report a “completion rate,” which excludes those who did not receive the survey from the calculation. In our above example, the completion rate is 83.3% because the 400 students who never answered the phone are excluded in the calculation. The completion rate will always be higher than the response rate as outlined above, which includes selected but uncontacted individuals in the denominator. Although a response rate seems simple to calculate, be sure to remember that it is important to understand how the response rate was calculated before you decide if the response rate is high.
The Impact of Nonresponse You may now be wondering what is an acceptable response rate. Babbie9 has suggested that a 50% response rate is adequate, 60% is good, and 70% is very good. Besides focusing on the numeric value of the response rate and how it fits with Babbie’s categorization, it is more important to determine if those who did respond are a representative cross section of the sampled group than it is to have a high response rate. In other words, it is critical for the survey researcher to assess if there are significant differences between the respondents and the sample.
In addition, ideally, a researcher will have meaningful information on those who did not respond. Demographic variables such as education, race, ethnicity, gender, age, and income may be helpful in assessing differences between respondents and nonrespondents. An assessment could show that those who did respond to the survey were quite similar in terms of education, race, ethnicity, gender, age, and income to those who did not respond. If the respondents and nonrespondents are quite similar, a researcher could legitimately analyze the results of a survey even if the response rate was extremely low (e.g., 10%). Basically, the effect of nonresponse on survey results depends on the percentage not responding and the extent to which those not responding are biased (i.e., systematically different from the population). Again, the issue isn’t specifically about the response rate, but more critically about whether the respondents and nonrespondents are similar or different on key characteristics that are related to the research questions.
Another issue that needs to be considered in determining the adequacy of the response rate is the population studied. You would expect a higher response rate from a survey of students in the Introduction to Criminal Justice course at your university than from a citizen survey in the same community, even though the topic may be the same. The students probably have a preexisting relationship with the researcher, which, coupled with the use of a group-administered survey (discussed later in this chapter), will lead to a higher response rate in comparison to a survey that is mailed to community residents. In addition, individuals that have an interest in the survey topic are more likely to respond to a survey than those who are less interested. Therefore, you can expect a higher response rate from a survey of police chiefs in California regarding the role of municipal police departments in fighting terrorism than from a survey of California residents on the same topic. Therefore, the adequacy of a response rate is more complex than merely looking at the number and determining how it measures up to Babbie’s stated standards.
An example of significant bias from low response and poor sampling where the respondents were significantly different from the population is the classic Literary Digest presidential poll in 1936. The survey, which was administered via mail, predicted a victory for Alf Landon in an election that Franklin Roosevelt won by a huge margin. The sample of addresses for the mailed survey was selected from telephone books. At the time, not everyone had a telephone so most voters were not listed in the telephone book. In addition, Republicans (those in Landon’s party) were much more likely to have telephones in 1936. Furthermore, only a minority of those asked to return questionnaires did so, which also led to the inaccurate survey results.
Overall, nonresponse is a problematic source of survey error. As the response rate decreases, it becomes more likely that the nonrespondents will differ from the survey respondents. When there are significant differences between respondents and nonrespondents, each group represents biased subgroups of the total population. Bias means that in some systematic way the individuals responding to a survey are different from the overall population. Therefore, the results based on the survey respondents are not reflective of the overall population.
Although we can calculate a response rate, we usually do not know for sure the impact of nonresponse on the survey results. Perhaps the strongest argument for efforts to increase response rates is credibility.14 When response rates are high, there is only a small potential for error due to nonresponse to have a significant impact on the survey results. When response rates are low, there is great potential for error due to nonresponse to have a significant impact on the survey results. Finally, a low response rate also provides critics of the survey results an easy, intuitive basis on which to say the data are not credible.
WHAT RESEARCH SHOWS: IMPACTING CRIMINAL JUSTICE OPERATIONS
What Causes Inmates to Riot?10
Early research into the causes of prison riots focused primarily upon the deprivations that are part of the prison environment. Gresham Sykes11 provided one of the first analyses of prison riots when he explored the causes of two riots that took place at the New Jersey State Prison in the spring of 1952. Sykes attributed the riots to changes in the inmate social system that had stripped the inmates of their control. Based on his observations, Sykes believed that the transfer of power from the inmate social system to prison staff exaggerated the deprivations experienced by inmates and contributed to the riots. His insights, however, failed to provide a complete understanding of why inmates rioted. Overcrowding, poor living conditions, lack of programming, guard brutality, poor administration, and a concentration of violence-prone inmates have all been cited as contributing factors to riots despite the fact that these conditions also exist in prisons where no riots have ever taken place. Further, Sykes’ explanations of prison riots were based on a case study (see Chapter 6) from a single prison facility where a riots had occurred.
In an effort to formulate a more comprehensive explanation for why inmates riot, Richard Wilsnack examined data from 48 state prisons. Included in his sample were prisons that had experienced a riot, some other type of collective inmate violence (e.g., work stoppage and hunger strikes), as well as prisons with no reported collective violence. He was the first to conduct a large-scale quantitative study of collective inmate violence. He created a 160-question survey that was mailed to 51 correctional institutions, including the largest state prison institution for each state and the District of Columbia. All of the prisons housed adult males convicted of felony crimes and were medium or maximum security facilities. Institutions were selected to be representative of the types of prisons where riots were most likely to occur. Only three states—Alabama, Kansas, and Mississippi—failed to respond to the survey, for a response rate of 94%. To improve the reliability of responses, questions were constructed in such a way that respondents had to provide only simple replies.
Twelve of the prisons surveyed reported a riot during the study period. The study identified several contributing factors to the riots. First, an analysis of prison conditions revealed that inmate deprivation, disorganization, and conflict existed in prisons where riots had taken place. Three-fourths of the prisons reporting a riot had experienced an increase in inmate assault and/or had at least one occurrence of an inmate assault on a guard. Second, administrative instability and conflict were related to prison riots. Three-fourths of the prisons reporting a riot had experienced major administrative changes (i.e., turnover or extended absences) and conflict among staff members. While a shortage of correctional staff was not related to the occurrence of a riot, low salaries and high staff turnover were found to be associated. Third, external pressures existed in prisons where riots had taken place. Wilsnack found that pressure and publicity from outside of the prison were also related to the occurrence of a riot. All of the riots had taken place in institutions where legislators and concerned citizens had tried to influence prison operations. In addition, 80% of these institutions had received some type of media coverage prior to the riot. Overall, riots were more likely to occur in maximum security prisons with overcrowding and unoccupied inmates. Furthermore, riots were more likely to occur in facilities where inmates of different ages, convictions, and prior records were all housed together. Wilsnack’s findings did not support Sykes’ contention that riots occurred as a result of a disruption of the inmate social structure.
Wilsnack’s quantitative study of inmate collective violence enhanced our understanding of prison riots and other forms of collective prison disturbances. Despite the difficulties in researching prison riots, our understanding of the causes has grown significantly over the past several decades. Researchers have uncovered many of the conditions associated with prison riots and several theories have been developed to explain their occurrence. Prison administrators today are better equipped to respond to prison riots with emergency response teams. These teams consist of officers trained in hostage negotiation and disturbance control.
This body of research has also helped prison administrators develop preventative measures to reduce the likelihood of riots. Regular security audits, consistent enforcement of rules and procedures, maintaining effective communication between inmates, staff, and administrators, providing inmates with structured activities and appropriate programs, and using inmate classification systems are all important strategies for preventing the occurrence of riots.12 The number of prison riots has significantly declined since the 1970s, despite the large increases in the number of inmates. According to Useem and Piehl,13 this trend can be attributed to more effective prison management.
Survey Question Design
Designing a good survey instrument involves selecting survey questions that are needed to answer your research questions. As discussed in Chapter 1, one of the initial steps in any research project is to develop a research question or questions. The same is true for survey research. Since responses to the survey questions are the data collected in surveys, the survey responses are used to answer your research questions. Therefore, it is critical that questions included in the survey are able to answer your research question. For example, if your research question is, “Is there a relationship between parental supervision and chronic truancy?” you need to ask survey questions that can measure the variables identified in the research question: parental supervision and chronic truancy. Designing a question for a survey instrument is designing a measure.
Besides the recognition that the survey questions must be able to be used to answer the research questions, how do researchers know what to ask on a survey? When building a questionnaire, a survey researcher has two sources for survey questions. First, the researcher can include survey questions that have been used in other surveys. When another researcher has already designed a quality set of questions to measure a variable in your research question, it is recommended that you use the items from the preexisting survey, with a few caveats. First, the existing survey questions must be reliable and valid, which will be discussed in the next section. For now, this basically means that the survey questions must be a quality measurement of the variable. For example, if you are creating a survey to address criminal victimization on your campus, a great starting point for developing the survey questions is to use the NCVS, covered in the chapter opening case study, as a template for your survey questions. You can certainly modify the questions to meet your specific needs, but the NCVS is a high-quality measurement of criminal victimization and so it is a reasonable place to start when creating the survey questions. Second, you need to provide appropriate citation to the original developer of the survey questions in the research manuscript. For example, Rosenberg15 developed a measure of self-esteem that is the most often used measure of self-esteem in survey research. In order to use the 10-question measure of self-esteem or a modified version, the researcher must provide appropriate citation to its original source.
A good source for prior surveys on a wide range of topics is the Inter-University Consortium for Political and Social Research (ICPSR) at the University of Michigan.16 Your university probably belongs to the ICPSR. ICPSR is a website depository where major social and political survey files are archived. If your university belongs to ICPSR, you can get codebooks for any study on file at ICPSR. The codebooks include the actual survey questions asked and the response formats used. The studies archived at the ICPSR cover a wide range of criminal justice and criminology topics, so it is a good starting place if you are ever tasked with developing a survey.
Second, when building a questionnaire, a researcher can include items that she has personally constructed. This is the favored option when a satisfactory measure of the variable does not already exist or the variables in the research question are unique. Despite the discussion above, do not think that every good question about a topic has already been asked. And do not think that the questions perfectly suiting your purposes have already been formulated. Finally, it is certainly reasonable to use both options (i.e., prior surveys and personally constructed items) when constructing a survey. As you are reading and evaluating survey research, the researcher should inform you about the source of the questions: whether based upon prior surveys or if questions were developed by the researcher.
RESEARCH IN THE NEWS
Want a Job? Check the Spelling on Your Facebook Profile.17
When it comes to looking for jobs, you better put your best Facebook forward. Recruiters are looking, and frankly, they are not impressed with your poor grammar or posts about your latest unforgettable exploits, according to a new survey. The survey was conducted by social recruiting platform Jobvite. The company surveyed more than 1,000 human resources and recruitment professionals on their social recruiting activities and intentions with over 800 responding to the survey. Respondents answered questions using an online survey tool.
In addition to checking your résumé, nearly 3 out of 4 hiring managers and recruiters check candidates’ social profiles, even if they are not provided on your résumé, with some of the content garnering negative reactions. Content that recruiters especially frown on includes references to using illegal drugs (78% negative) and posts of a sexual nature (67% negative). Profanity in posts and tweets garnered a 61 % negative reaction, and almost half (47%) reacted negatively to posts about alcohol consumption. Worse than drinking, grammar or spelling mistakes on social profiles saw a 54% negative reaction from respondents. However, recruiters and hiring managers tend to be neutral in their reactions to political opinions (62% neutral) and religious posts (53% neutral).
Survey Questions and Answers: The Presence of Error
In order to conceptualize the error associated with answers to survey questions, it important to address what a survey is designed to measure. At its most basic, surveys try to measure two items: objective facts and subjective states. Objective facts include the number of times a person has been arrested, whether or not a person has used marijuana in the past week, and whether or not a person has been the victim of theft in the past 6 months. Subjective states include a person’s level of attachment to his parents and a person’s viewpoint on the primary purpose of prisons.
As will be discussed in the next section, the way we assess the answers to a survey question is to measure how well they correspond to the truth. If you are asking survey respondents about objective facts (e.g., how many times have you been arrested?), you can obtain independent information (e.g., criminal history information from a statewide database) against which to evaluate the answers to the survey question. Unfortunately, there is no objective way to verify or evaluate a person’s report about a subjective state (e.g., viewpoint on the primary purpose of prisons). There is no way to independently assess whether the person is telling the truth, which can cause error in the survey results.
A defining characteristic of survey research is that answers to the survey questions are used as the measurements of the concepts and variables in the study. The extent to which those answers are good measures of the concepts and variables is obviously a critical dimension of the quality of survey results. The extent to which the answers are not good measures creates survey error. Survey error comes from several areas, including misunderstanding the question, not having the information needed to answer, and distorting answers in order to look good, to name a few.18 For example, respondents typically underreport how much alcohol they drink and overstate their income. Survey results of alcohol consumption and income are likely to be biased (i.e., systematically different from the true scores). The issue is that to the extent that answers are impacted by factors other than the facts on which the answer should be based, there is error in the answer.19 The next section discusses the quality of the survey measurement and related error by discussing reliability and validity.
Survey Measurement Quality: Validity and Reliability
Assessing the quality (i.e., accuracy and consistency) of a survey measurement is a critical part of the research process. A survey researcher can spend days developing what he views as an excellent survey, but if the survey questions and responses are not accurate and consistent, the results of the study are questionable. Accurate and consistent survey questions and responses are essential to getting accurate results and making conclusions that reflect the true reality of the topic being studied. Specifically, the two key components of survey quality are reliability and validity. In order to be a high-quality measurement, survey questions and responses must be both reliable and valid. Reliability is necessary for quality measurement, but not sufficient. A quality measure must also be valid. Similarly, just because a measure is valid doesn’t necessarily mean it is reliable, and validity means little if the measure used is not reliable.
Validity addresses the accuracy of the measurement and refers to the extent to which researchers measure what they planned to measure. Validity refers to the accuracy and trustworthiness of survey instruments, data, and findings. The question asked when assessing validity is: “Are the survey questions measuring what they are intended to measure?”
Reliability addresses the consistency of a measurement and refers to whether or not you get the same answer if you use an instrument to measure something more than once. For example, if a police radar gun is used to measure the speed of two vehicles going the same speed and the same results are obtained, then the radar gun is reliable. Similarly, if a breathalyzer is administered to two individuals with the same blood alcohol level and the breathalyzer gets the same results each time, then the breathalyzer is reliable. In these cases, the radar gun is a reliable measure of the speed of automobiles, and the breathalyzer is a reliable measure of blood alcohol content (i.e., level of intoxication).
As previously discussed, surveys generally assess two different types of information: objective facts and subjective states. Generally, it is easier to accurately and consistently measure objective facts than subjective states. For example, it is easier to accurately and consistently measure a survey respondent’s gender, race, ethnicity, and education level (i.e., objective facts) than it is to measure a survey respondent’s opinion (i.e., subjective state) regarding the level and quality of police service provided to the community. The extent to which a survey is unreliable and invalid creates measurement error, which is a persistent problem in criminal justice and criminology research. One of the major sources of error in research studies is poor quality of the measurements.
Both validity and reliability must be present for high-quality research results. This section will address ways to measure and increase the validity and reliability of a measurement. It is important to note that validity and reliability do not just apply to survey research but to measurement completed in all research designs, including experimental designs (Chapter 5), field research (Chapter 6), case studies (Chapter 6), secondary data analysis (Chapter 7), and content analysis (Chapter 7). Since this is the first chapter to discuss measurement, a comprehensive review of validity and reliability is presented here. As you proceed through the remainder of this book, keep in mind that validity and reliability apply to all types of measurement that are completed in research studies.
Assessing Validity
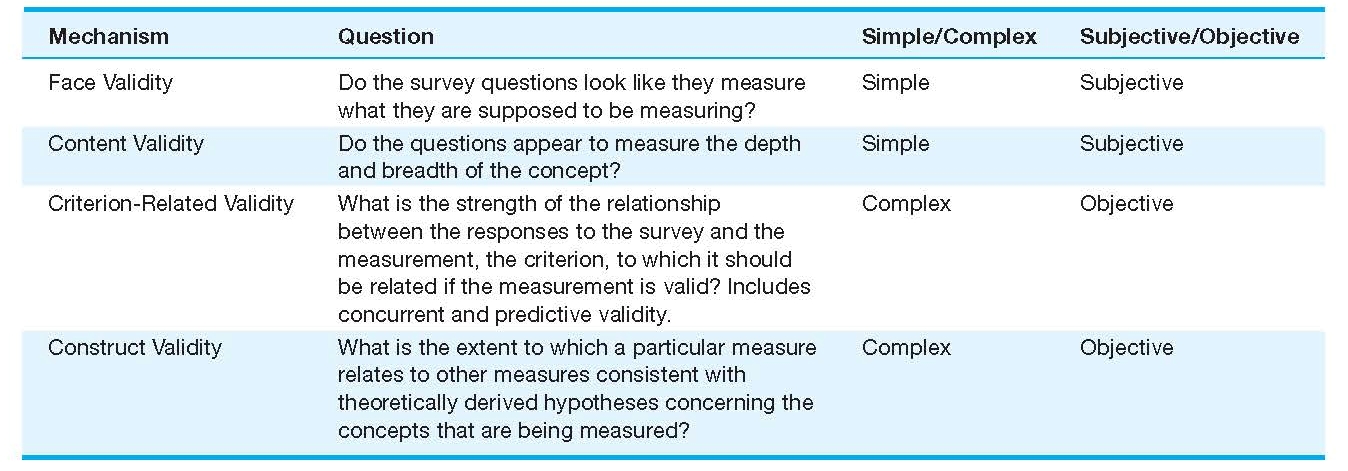
Validity addresses the accuracy of the measurement and refers to the extent to which the survey questions and responses measure what they were supposed to measure. In other words, are the survey questions and responses good indicators of what the researchers are trying to study? Stated another way, are the survey questions and responses measuring what they are intended to measure? There are numerous ways to assess the validity of measures. The ways range from simply asking if the measures seem like logical and common sense ways to measure the concepts and variables (i.e., face validity) to the complexity of determining whether the measures fit the theoretical constructs of the concept being measured (i.e., construct validity). Even though researchers may use sophisticated ways to assess the validity of their measures, concerns about the validity of the measure may still persist because of the complexity of the concepts studied by criminal justice and criminology researchers. In addition, validity is never proven; instead, invalidity is reduced, and when this occurs researchers express greater confidence in their data and the results of their study. There are several ways of assessing if the measures used in a study are valid: face, content, criterion-related, and construct validity. The different means of assessing validity vary by complexity and subjectivity.
Face validity, the simplest and most subjective means to measure validity, assesses whether the survey questions are a logical and common sense way to measure the concept. Basically, face validity involves an assessment of the survey questions to see if on “face value” the questions seem to be measuring the concepts and variables they are supposed to be measuring. Face validity answers the simple question, “Do the survey questions look like they measure what they are supposed to be measuring?” For example, if a researcher is measuring fear of crime, does the survey instrument ask questions about specific types of crime and the level of fear for each? If so, the survey has face validity.
Face validity is sometimes developed based on establishing a consensus among researchers that the measure is a valid way to measure the concept. For example, if researchers generally agree that asking someone “How many times have you been arrested?” is a valid measure of prior arrests, then, until proven otherwise, the question is a valid measure of prior arrests. However, because face validity is entirely a matter of judgment, there can be great disagreement among researchers and consumers of research about whether a survey question has face validity.
Content validity is subjective, just like face validity, but is somewhat more complex than face validity. It occurs when the survey questions measure the full breadth and depth of the concept being studied. For example, let’s say that when you have completed Chapters 1–4 of this book, you are scheduled to take an exam over Chapters 1–4. What if when you take the exam, your professor only asks questions about sampling, which is covered in Chapter 3? You would probably argue that the test was not fair and was not a good measure of your knowledge of Chapters 1–4 because it only covered Chapter 3. What you are stating is that the test, as a measurement of knowledge of the material covered in Chapters 1–4, lacks content validity. In order to have content validity, the test should have included questions over Chapters 1, 2, 3, and 4.
As another example, there exists a traditional measure of fear of crime that lacks content validity. Traditionally, fear of crime was measured in surveys based on the response to the question, “How safe do you feel walking alone in your neighborhood at night?” This question lacks content validity because it does not measure the full breadth and depth of someone’s fear of crime. It is basically limited to fear of street crimes like robbery and assault, but does not include crimes that people fear but occur in their residences, such as sexual assault, family violence, burglary, and theft. Also, the question is limited to your neighborhood, whereas you may have a high level of fear of crime but it is due to getting off late at night from your job and having to walk through a deserted parking garage to get to your car. Furthermore, the question is time dependent, only asking about fear of crime at night.
When it comes to criminal justice and criminology research, content validity is difficult to obtain because researchers are trying to measure complex concepts. When studying criminal offending, it is difficult to ask about all types of crimes; there are just too many. Similarly, when studying drug use, it is difficult to ask about all types of drugs. However, just as discussed with face validity, consensus among researchers is used to determine content validity.
Criterion-related validity is more complex and less subjective than face and content validity. Criterion-related validity is assessed by determining the strength of the relationship between the responses to the survey and another measurement, the criterion, to which it should be related if the measurement is valid. For example, let’s say that you want to create a measure of self-esteem. As previously mentioned in this chapter, the 10-question measure of self-esteem created by Rosenberg in the 1960s is a valid measure of self-esteem. You create a 16-question measure of self-esteem but will want to determine if the measure is valid. You can give a sample of people a survey that includes both the Rosenberg questions and your new questions about self-esteem. You can then determine the relationship between the responses to your measure of self-esteem in comparison to Rosenberg’s questions, the criteria. If individuals that have high self-esteem according to Rosenberg’s measure consistently have high self-esteem according to your new measure of self-esteem, then your measure has criterion-related validity. If individuals have high self-esteem according to Rosenberg’s measure but consistently have low self-esteem according to your new measure, then your measurement of self-esteem lacks criterion-related validity.
As another example, you may be interested in pursuing law school after completing your bachelor’s degree. Admission committees at law schools use the Law School Admission Test (LSAT) to predict success in law school. They prefer to admit students with high LSAT scores because they believe those are the students most likely to do well in law school. If there is a strong relationship between the LSAT score and success in law school as measured by law school grades, then the LSAT has high criterion-related validity. The LSAT is related to something that it should be related to, in this case, law school grades.
There are two types of criterion-related validity: concurrent and predictive validity. A measurement has high criterion-related validity, more specifically high concurrent validity, when there is a strong relationship between a new measure and a measure that is known to be valid. The example above regarding Rosenberg and a new measure of self-esteem is an example of concurrent validity. Concurrent validity occurs when an experimental measure (e.g., your new self-esteem measurement) and a valid measure (e.g., Rosenberg’s self-esteem scale) measure the same thing at the same time (i.e., concurrently).
Concurrent validity is also assessed when a response to a survey item is compared to the same information from a different data source. For example, let’s say your professor asks your current grade point average on a self-administered survey. Then, your professor uses your university’s information system to obtain your official GPA. The more these two numbers correspond (i.e., your stated GPA and your official GPA), the higher the concurrent validity of the survey measurement of GPA. In criminal justice and criminology research, this process can occur to validate survey information that is also stored by criminal justice agencies such as prior arrests, convictions, and incarcerations, to name a few.
Another way to assess concurrent validity is to use what is sometimes referred to as the known group comparison technique. Let’s say that you want to develop a measure of religiosity because you want to study the impact of religious beliefs on delinquent activities. Although valid measures of religiosity exist, you want to develop your own measure. After you have developed the survey questions, you administer the survey to members of the clergy and members of Atheist Alliance International (AAI). If your survey measure of religiosity shows that the members of the clergy have high levels of religiosity and members of AAI have low levels of religiosity, then you have established the concurrent validity of your measure. The items in your survey measurement are measuring what they were intended to measure (i.e., level of religious beliefs). If the measurement doesn’t differentiate the level of religious beliefs between members of the clergy and AAI, then there is something wrong with your survey questions.
Another type of criterion-related validity assesses how accurately a measurement predicts some future, rather than current, outcome similar to the example previously discussed regarding the LSAT as a prediction of law school success. This type of validity is referred to as predictive validity. Let’s say that you develop a set of survey items that is designed to determine if someone will be a successful police officer. A local police department decides to assist you with your study and allows you to issue your survey to the current police recruit academy class of 175 cadets. You track these police recruits for the next three years after completion of the police academy and field training program. If the individuals who scored highest on your survey while in the academy are also the most likely to have received promotions, excellent performance evaluation reviews, and fewer disciplinary infractions, then your measure has predictive validity. Police departments can now use this measurement tool to screen potential police officers with confidence in its ability to predict future success.
We frequently use measures in the criminal justice system to make decisions, including whether a crime can be solved, whether someone should be let out of jail on bail, whether a person should be released from prison on parole, and whether a person should be placed on a general probation caseload or a specialized caseload. These measures are only as good as their level of predictive validity; ability to predict some future outcome. If they have predictive validity, then we can have confidence in the predictive accuracy of the measurement.
Another way of assessing the accuracy of a measure is to determine its construct validity. Similar to criterion-related validity, construct validity is more complex and less subjective than face and content validity. Construct validity assesses the extent to which a particular measure relates to other measures consistent with theoretically derived hypotheses concerning the concepts/variables that are being measured. Since construct validity is based on theory, it is favored by researchers.
For example, prior research has established a relationship between self-esteem and delinquency. Juveniles with high self-esteem are less likely to commit delinquent acts than juveniles with low self-esteem. You want to conduct a research study to test the following hypothesis: There is a relationship between self-esteem and delinquency. As presented in prior examples, let’s say that you want to create your own measure of self-esteem instead of using Rosenberg’s validated measure. You create your new 16-item measure of self-esteem and use a prior validated measure of delinquency. You administer the survey to the 8th graders in the middle school closest to your residence. The results show that those with high levels of self-esteem are less likely to commit acts of delinquency and those with low levels of self-esteem are more likely to commit acts of delinquency. This is exactly what was expected based on your theoretically derived hypothesis regarding the relationship between self-esteem and delinquency. Therefore, your new measure of self-esteem has construct validity. If the survey results would have shown that those most likely to be delinquent also have the highest levels of self-esteem, then your measurement of self-esteem would lack construct validity and the results of the study would be suspect. As depicted in the example, construct validity is based on actual research results and is not obtained until after the data has been collected and analyzed. Other researchers can begin to use your measure of self-esteem because you have shown that it has construct validity.
FIGURE 4.1 | Mechanisms for Assessing Validity
Increasing Validity
Now that we have presented the main approaches to assessing validity, we turn our attention to discussing ways to increase the validity of a survey instrument. As previously discussed, it is certainly reasonable for a researcher to use measures that have already been established as valid. If you are studying victimization on your college campus, it is certainly reasonable to develop your survey based on the National Crime Victimization Survey since the validity of this measurement has already been established. Even though a researcher may be using a previously established measure, there are validity issues that must be addressed in every research study. This section will discuss the major validity issues and the suggested means to overcome them, thereby increasing the validity of a research study. As an educated consumer of research, you should be aware of these issues as you review research reports. One significant validity issue with survey research is whether respondents are telling the truth.
Are the Respondents Telling the Truth? Aiding Respondent Recall Recall that validity is addressing the accuracy of the measurement. Survey responses are usually accurate and truthful when the survey questions ask about a behavior or incident that is easily remembered. Most offenders can easily remember how many times they have been arrested in the past month, but it is more difficult for a drug abuser to remember how many times they have used illicit drugs in the past month. It is likely that the number of arrests in the past month will be a more accurate response than the number of times an abuser has used drugs in the past month.
It is clear that a respondent’s ability to accurately recall events declines over time and accurately recalling events typically takes more time than the few seconds that a respondent has to answer a survey question. As discussed in the chapter opening case study, a major source of error of the National Crime Victimization Survey (NCVS) includes the inability of the respondents to recall in detail the crimes that occurred during the 6 months prior to the interview. The NCVS uses a 6-month reference period. Respondents are asked to report victimization experiences occurring in the last 6 months. Generally, respondents are able to recall more accurately an event that occurred within 3 months of the interview rather than one that occurred within 6 months. Research indicates that assault is recalled with the least accuracy of any crime measured by the NCVS. Recall problems may result in an underestimate of the actual rate of assault.
Survey researchers recognize that memory is less trustworthy than once assumed. In response, strategies have been developed to maximize respondent recall. Survey researchers should be as specific and recent as possible when asking about past events. You can improve accuracy by making the recall period for the survey questions recent. The problem of forgetting becomes increasingly serious as the respondent is asked to recall events stretching over a longer period of time. In addition, the researcher should clearly specify the behavior asked about. The complexity of respondent recall does not mean that survey researchers cannot ask about past events. Instead, survey researchers need to customize questions to shorten the recall period and interpret results cautiously as the recall period grows larger.
In addition, many respondents will telescope their responses. Telescoping occurs when a respondent brings behaviors and actions that occurred outside the recall period into the recall period. For example, let’s say that a person was assaulted 8 months ago and has not been assaulted since that time. The person is answering a survey question that asks “How many times have you been assaulted in the past 6 months?” and the survey respondent answers “one time.” The respondent has telescoped the victimization into the 6-month time frame even though it occurred 8 months ago and was outside the time frame provided by the researcher. Telescoping responses leads to overreporting of recent events and underreporting of distant events.
Are the Respondents Telling the Truth? Asking Embarrassing and Stigmatizing Questions People have a tendency to underreport embarrassing or stigmatizing events (e.g., hitting their children, being a sexual assault victim, and lying on their tax return). Criminal justice research asks about many potentially embarrassing and stigmatizing topics such as criminal offending, victimization, drug use, alcohol consumption, mental illness, and prison rape, to name a few, thus making truthful reporting a challenge in criminal justice research. Respondents may be embarrassed or afraid to give truthful answers and thus, underreport behaviors or attitudes they wish to hide from others. As an educated consumer of research, you need to be aware of and assess the strategies a researcher uses to increase the honesty of survey responses.
Dishonest answers can be difficult to detect, so what strategies exist to increase the honesty and therefore, accuracy of survey responses? First, researchers should inform respondents that their responses are, at a minimum, confidential, and if possible, anonymous. Anonymity infers that the survey respondent’s identity will not be known by the researcher. For example, if a professor hands out a survey in her class to the 150 people in attendance, asks them to respond to the survey and hand them to the end of the seating row where they are picked up by the professor, the surveys are anonymous. The professor does not know who filled out a particular survey. Anonymously collecting survey information, especially if it is of a sensitive or criminal nature, is one of the simplest ways to increase the honesty of responses. Respondents will be more honest regarding sensitive or embarrassing topics when they know their responses cannot be used to harm or embarrass them.
Confidentiality infers that although the researcher may be able to link the information given on a survey or during an interview to the particular research participant who gave it, this link will not be released to anyone else besides members of the research team. For example, a researcher who does face-to-face interviews will certainly know the identity of the respondent but promises to keep the responses in confidence.
Second, survey researchers should try to ensure that sensitive questions are asked in a nonjudgmental way. The researcher should minimize any sense of judgment and maximize the importance of accuracy. Careful attention should be paid to the wording of the introduction and the question to ensure that nothing negative about the behavior is implied to the respondent. The researcher needs to be very careful about any cues respondents are receiving about how their answers will be interpreted. These questions must be asked with great care and great empathy.
Third, the survey researcher should use a self-administered data collection procedure (discussed later in this chapter). It is generally agreed that having respondents answer questions in a self-administered form, on paper or directly into a computer, rather than having an interviewer ask the questions, will produce more honest answers. For surveys dealing with sensitive topics, a mail survey, Internet survey, or group administration survey should be considered. A face-to-face interview can also include some self-administered questions where a respondent is given a set of sensitive questions to answer in a booklet or directly into a computer. A similar strategy can be used with telephone surveys where answers to sensitive questions are entered directly into a computer using the touch-tone feature on the telephone.
Fourth, respondents feel more comfortable answering potentially sensitive questions when the responses are provided as categorical ranges rather than as a specific number. For example, a researcher may get a more honest answer if instead of asking, “What is your annual income?” the researcher provides the respondent with ranges of income from which to choose a response (e.g., less than $20,000, $20,000–$35,000). A respondent’s age can be collected with categorical ranges, instead of a specific age, as well. Especially with demographic characteristics, the more sensitive the question, the better it is to use response categories instead of specific numeric values.
Fifth, the survey researcher can use a randomized response technique (RRT), which allows the researcher to ask about illegal and sensitive behaviors and obtain accurate estimates of the frequency of the behavior. Here’s how it works. Let’s say you are interested in the frequency of excessive force used by correctional officers. You are conducting face-to-face interviews with a sample of correctional officers at a prison unit. Your interviewers define excessive force for each respondent. But instead of your interviewers asking correctional officers the question directly, they give each respondent a randomization device, such as a coin. They ask the respondent to flip the coin. They tell the respondent not to tell them the results of the coin toss. Then they instruct the respondent as follows: “Say Yes if either of the following is true: Your coin came up heads, or you have used excessive force against an inmate in the last month.”
If the respondent says yes, the interviewer does not know which question is being answered. Did the correctional officer say yes because the coin landed on heads or because the officer has used excessive force against an inmate in the last month? If this procedure was repeated with 100 respondents, based on probability theory, you would expect 50 out of 100 to say “Yes,” simply because their coin toss came up heads. Therefore, if you find that 68% of the respondents say “Yes” to this question, you estimate that the 18% above the expected 50% represents correctional officers who used excessive force against inmates in the past month. Thus your finding is that 18% of correctional officers use excessive force against inmates in any given month.
Sixth, although this will be discussed in a later section of this chapter, realize that researchers can use one of the reliability tests, such as split-half reliability, to detect untruthful responses. Researchers ask the same or similar questions in different sections of a survey to determine if respondents were truthful in their responses. Surveys in which the truthfulness of the respondent is questioned should be discarded from the study prior to analysis.
Are the Respondents Telling the Truth? Social Desirability People have a tendency to overreport something if it makes them look good (e.g., willingness to intervene in a crime to protect someone). Survey researchers call this overreporting social desirability bias. Social desirability bias occurs when respondents provide answers to survey questions that do not necessarily reflect the respondent’s beliefs but that reflect social norms. If social desirability bias is widespread, it can have a significant impact on the results of the study.
One of the best examples of social desirability bias is LaPiere’s20 study of attitudes and behaviors towards hotel and restaurant service of Chinese people. Beginning in 1930 and continuing for two years thereafter, LaPiere traveled across the United States in an automobile with a young Chinese student and his wife. The early 1930s was a time when the general attitude of Americans toward Chinese residents was negative and was well documented in several social distance studies completed at the time. There was a national negative stereotype of Chinese citizens at the time, and the social norms of the time were to react negatively to individuals of Chinese descent. Discrimination against Chinese residents was common as well.
LaPiere discovered substantial differences between the stated attitude of survey respondents and actual behavior. During their extensive travels, the Chinese couple was received at 66 hotels, auto camps, and “tourist homes,” and was only refused service at one. Similarly, they were provided service in 184 restaurants and cafes throughout the United States and were never refused service. To assess differences between stated attitude and behavior, LaPiere completed a mailed survey six months after departure from 22 of the hotels and 43 of the restaurants they visited and asked “Will you accept members of the Chinese race as guests in your establishment?” To his bewilderment, 91% of the hotels and 93% of the restaurants answered “No,” even though he had a personal experience with each of the establishments where all but one provided service to the Chinese couple. Simply stated, he discovered what people say is not always what they do.
LaPiere’s study certainly illustrates the difference that occurs sometimes between stated attitudes on surveys and actual behaviors. Just because someone says they would or would not do something on a survey, does not necessarily mean that will relate to the respondents’ actions. In this case, LaPiere observed substantial discrepancies between attitudes and behaviors.
This study is also a reflection of social desirability bias. At the time, the social norms dictated a negative reaction to individuals of Chinese descent. When presented with a question about whether they would provide service to someone of Chinese descent, almost all of the respondents reflected the social norms at the time and responded “no.” As stated above, social desirability bias occurs when respondents provide answers to survey questions that do not necessarily reflect the respondent’s beliefs but instead reflect social norms, and that is certainly the case in LaPiere’s study.
In order to detect social desirability, some survey researchers include the same or similar questions in different sections of a survey to determine if respondents were truthful in their responses, as previously mentioned. Researchers can also build in questions that are likely to identify respondents who are giving socially desirable answers. For example, the researcher may ask survey questions that include words such as “always” and “never.” People rarely “always” or “never” do or feel something, so respondents who routinely select these responses are probably depicting social desirability bias. Another way to detect social desirability bias is to include unlikely choices in the closed-ended survey questions. Surveys in which the truthfulness of the respondent is questioned should be discarded from the study prior to analysis.
CLASSICS IN CJ RESEARCH
The Relationship Between Correctional Officers’ Race and their Attitudes
Research Study21
Historically, correctional officers were white, uneducated, conservative males who lived in the rural areas where most prisons were located. Beginning in the 1950s, prison populations started to change as more urban blacks were sent to prison. Racial tensions between inmates and guards escalated. Black inmates had not only become more prevalent in number, they stood as a unified group against the guards who perceived them as a greater threat compared to the white inmates. Many reformers advocated increasing the number of black prison guards as a way to reduce conflict and antagonism between guards and inmates. The assumption was that black guards would be able to relate better to the black inmates because they shared similar backgrounds. Whether or not the attitudes held by black prison guards toward inmates were any different from those held by white guards remained an untested assumption until the late 1970s when James Jacobs and Lawrence Kraft conducted an empirical test of correctional officers’ attitudes.
The authors tested the following five hypotheses:
1. Black guards have more sympathetic attitudes toward inmates compared to white guards.
2. Black guards are more supportive of rehabilitation compared to white guards.
3. Black guards convey less support for their superiors compared to white guards.
4. Black guards are less committed to institutional goals compared to white guards.
5. Black guards are less committed to their occupations compared to white guards.
Research Question
Is there a relationship between correctional officers’ race and their attitudes toward inmates, correctional goals, administrators, and correctional officer roles?
Methodology
The authors administered a survey to a sample of 252 guards from Stateville and Joliet prisons who were attending in-service training. Both prisons were maximum-security facilities within seven miles of each other. Three-fourths of the inmate populations in both prisons were black, and most of the prisoners came from the Chicago area (the prisons were 35 miles southwest of the city). At the time the survey was administered, 12% of the correctional officers employed by the Illinois Department of Corrections were black and most of them were working at Stateville and Joliet.
The survey was administered to guards while they attended in-service training at the Correctional Academy between the summer of 1974 and fall of 1975; 165 white guards and 66 black guards completed the survey; 21 guards were excluded from the sample because they did not indicate their race and/or rank on the questionnaire. Prison guards were group-administered an anonymous survey and asked to respond to a series of questions that consisted of both closed-ended and open-ended questions.
Specifically, inmate orientation consisted of a 10-item measure, one question open-ended and the other nine closed-ended, which asked questions such as, “Inmates try to take advantage of officers whenever they can.” Job orientation consisted of a 7-item measure, which asked all closed-ended questions such as, “Although understanding may be important in helping inmates, what is really needed is strictness.” Staff orientation was a 3-item measure, all closed-ended questions such as, “When I began, the veterans were friendly and helped me learn.” System orientation was a 5-item measure, one question open-ended and the other four closed-ended, such as, “Why are there so many members of minority groups in prison?” Job commitment was a 9-item measure with all closed-ended questions such as, “Thinking ahead five years from now, do you think you will still be a correctional officer?”
Results
The results of the study for each hypothesis are presented below.
1. Hypothesis: Black guards have more sympathetic attitudes toward inmates compared to white guards.
Study finding: Black prison guards did not express attitudes that were more sympathetic toward inmates compared to white guards. The responses of black guards to several questions actually revealed less sympathy. The hypothesis was rejected.
2. Hypothesis: Black guards are more supportive of rehabilitation compared to white guards.
Study finding: Black and white prison guards both indicated that rehabilitation was the primary purpose of prison, but when asked what the “primary purpose of prison should be,” more black guards than white guards chose punishment. The hypothesis was rejected.
3. Hypothesis: Black guards convey less support for their superiors compared to white guards.
Study finding: Black prison guards responded more favorably to their superiors than white guards even though most of the prison administrators and supervisors at the two prisons were white. The hypothesis was rejected.
4. Hypothesis: Black guards are less committed to institutional goals compared to white guards.
Study finding: Black officers do not support a more relaxed correctional process. The majority of both races disagreed with the statement that “correctional officers should be rough with inmates occasionally to let them know who is boss,” but blacks more often gave approval to the statement. The hypothesis was rejected.
5. Hypothesis: Black guards are less committed to their occupations compared to white guards.
Study finding: The responses of both black and white guards indicated a strong sense of institutional commitment. Two-thirds of the guards sampled responded that they planned to be working at the prison for at least the next five years. Many of the guards expressed a preference for their current occupation over other alternative options such as private security and police work. The hypothesis was rejected.
Overall, the conclusion was there were no consistent differences by race in guards’ attitudes toward prisoners, staff, correctional goals, or their occupation. According to the study authors, “There is nothing in these responses to suggest that black guards treat inmates with greater respect or sensitivity. They do not hold more rehabilitative views. Nor have they aligned themselves with the inmates against the administration.”22
Limitations with the Study Procedure
Jacobs and Kraft recognized one of the potential validity issues with their questions was social desirability. Guards’ responses may have been self-serving. Respondents may have provided “socially desirable” answers. The guards may have responded to the questions in terms of how they felt they should respond, not based on their own personal feelings. The extent that social desirability influenced the guards’ responses was not known. As discussed in this chapter, social desirability is a source of measurement error that threatens the validity of a researcher’s measures. Survey questions are valid only if they correctly assess the phenomenon under study; in this case, the guards’ attitudes toward prisoners, staff, correctional goals, and their occupation.
Another limitation of this study is that the sample of prison guards was not randomly selected. A non-probability sampling method was used to draw the sample. As discussed in Chapter 3, since a non-probability sampling method was used, in this case purposive sampling, the sample of prison guards selected for this study are likely not representative of a larger population. Jacobs and Kraft purposely chose prison guards from Joliet and Stateville prisons who were completing in-service training at the state’s Correctional Academy because most of the black prison guards in Illinois worked at these two prison facilities. However, since non-probability sampling was used, the sample may not even be representative of all prison guards in these two prison facilities and is even less likely to be representative of prison guards in Illinois or the United States. Therefore, the results may not be generalizable to these other populations.
Reliability issues may have arose with the wording of some of the survey questions as well. For example, in the inmate orientation scale, Jacobs and Kraft asked “in your opinion, when just considered as people, how similar are guards and prisoners?” The question was supposed to mean how similar is the prison guard answering the question to the inmates. Respondents may have understood the question differently with some respondents having answered in terms of other guards or most guards, not themselves personally. Therefore, it may be misleading to consider this item an indicator of perceived distance between self-as-guard and prisoners.
Impact on Criminal Justice
Jacobs and Kraft recommended that recruitment of minority guards was itself an important societal goal, because it expanded job opportunities in an area where minorities had been traditionally excluded. For this reason alone increasing the proportion of black guards is socially justifiable as well as legally compelled. The study discovered, though, that we should not unquestioningly accept the belief that this change in demographic composition of the work force will automatically have a major impact on the atmosphere of the prison.
Neither black nor white guards displayed attitudes that indicated they were more “inmate oriented.” The similarities suggested that the attitudes might have been formed as a result of their socialization into the prison environment. Just as police officers develop “working personalities” that influence their interactions with the public, guards display certain attitudes and behaviors toward inmates. Numerous studies published after Jacobs and Kraft have identified various organizational influences on guards’ attitudes.
The number of black correctional officers employed in prisons across the United States has increased in the years since Jacobs and Kraft published their study. Jacobs and Kraft were the first to explore the influence of race on correctional officer attitudes and, since then, numerous studies of correctional officers’ attitudes have been published. The debate over whether or not hiring more black correctional officers will ease racial tensions between officers and inmates continues due to contradictory research findings, but according to Jurik,23 it would be unrealistic to expect significant improvements to the prison environment by simply hiring officers with particular demographic characteristics.
Increasing Validity: Using Scales and Indexes
Recall that validity addresses the accuracy of the measurement and refers to the extent to which the survey questions and responses measure what they are supposed to measure. One way of increasing the validity of your survey questions and responses is to ask multiple questions to measure the same concept, especially if the concept is complex. You do not need to ask five different questions to measure a respondent’s age. But, what about measuring parental attachment? You could have one question in your survey that asks, “What is your level of parental attachment?” but there are validity issues with asking just one question to measure a complex concept. As an alternative, you could ask the following 11 questions to measure parental attachment:
How often would you say that...
1. You get along well with your mother?
2. You feel that you can really trust your mother?
3. Your mother does not understand you?
4. Your mother is too demanding?
5. You really enjoy your mother?
6. You have a lot of respect for your mother?
7. Your mother interferes with your activities?
8. You think your mother is terrific?
9. You feel very angry toward your mother?
10. You feel violent toward your mother?
11. You feel proud of your mother?
The response categories for each question can be almost never, sometimes, most of the time, almost always.
Which is a better, more valid measure? Certainly, the measurement of parental attachment that asks 11 different questions is a higher quality measurement than just asking one question. In fact, the questions above were used by Bjerregaard and Smith24 in their assessment of gender differences in gang participation. Their measurement of parental attachment is an adaptation of Hudson’s25 Child’s Attitude Toward Mother (Father) Index, a well-standardized and validated index in the family assessment literature. By asking multiple questions to measure a complex concept, the researcher is able to even out response idiosyncrasies and improve the validity of the measurement.
Therefore, to measure a complex concept, researchers construct scales and indexes. These words are often used interchangeably in research methods, but they are actually different, so we will make some distinctions between the two. An index is a set of items that measure some underlying concept. Creating an index involves developing a set of items that, taken together, are indicators of the underlying concept you are attempting to measure. For example, every weekday the Dow Jones Industrial Index (DJJI) is reported on the nightly news. The DJII is a set of numerous stocks that are combined to create a single number. Rosenberg’s self-esteem measure, which was previously discussed, is an index. It uses 10 questions to measure the underlying concept of self-esteem. Similarly, the 11 parental attachment questions listed above form an index. The 11 items, taken together, are indicators of the underlying concept of parental attachment. So, when multiple questions are used to measure a complex concept, an index has been created.
What does a researcher do with the responses to the individual questions that make up the index? The researcher calculates an overall index score by summing the responses to all of the questions. The score serves as the indicator of your level of the concept being measured. Let’s use the parental attachment index as an example. Each of the 11 questions had four possible response categories: almost never, sometimes, most of the time, almost always. Almost never is coded as 1, sometimes is coded as 2, most of the time is coded as 3, and almost always is coded as 4. Each respondent’s answers to all questions are summed to get a single number that represents the respondent’s level of parental attachment. The scores range from 11 (i.e., answered each question as “almost never”) to 44 (i.e., answered each question as “almost always”) with a higher score representing a higher level of parental attachment. One respondent may have a score of 22 on the parental attachment index while another respondent may have a score of 37, the latter having a higher level of parental attachment than the former.
If you tried to do the scoring of the parental attachment index on your own, you may have run into a problem. Some of the questions are positive (e.g., you get along with your mother) and some are negative (e.g., your mother is too demanding). A response of “almost always” on the first question in the previous sentence demonstrates a high level of parental attachment, but a response of “almost always” on the second question in the previous sentence demonstrates a low level of parental attachment. How does a researcher deal with this issue? The answer is the researcher reverse codes the negative statements. Instead of using the 1-4 coding scheme discussed in the last paragraph, the researcher reverses the code for the negative items. In this case, almost never is coded as 4, sometimes is coded as 3, most of the time is coded as 2, and almost always is coded as 1. Therefore, when a respondent answers “almost never” to the “your mother is too demanding” question, the answer is coded as a 4, which demonstrates a high level of parental attachment.
A scale is a set of questions that are ordered in some sequence. The researcher is seeking a pattern from the respondent’s answers to the set of questions, rather than a simple summation of the individual question responses, as happens with indexes. For example, Guttman scales are used by survey researchers and are ordered in such a way that agreement with a particular item indicates agreement with all the items that come earlier in the ordered set of statements. Consider the following Guttman Scale regarding immigration.
Place a check next to each statement you agree with
—— I would be comfortable with the United States expanding immigration.
—— I would be comfortable with new immigrants moving into my city.
—— I would be comfortable with new immigrants moving onto my block.
—— I would be comfortable with new immigrants moving next door to me.
—— I would be comfortable with a new immigrant dating my child.
—— I would be comfortable with a new immigrant marrying my child.
The items are ordered so that agreement with the fourth item would also indicate a strong likelihood of agreement with the first three statements. If the respondent is not comfortable with new immigrants moving into his city, then he is definitely not going to be comfortable with new immigrants moving next door.
You have probably also heard someone say “On a scale of 1 to 10 ...” For example, it is common for health care providers to ask patients to rate their pain on a scale of 1 to 10. You have probably also heard someone mention the term Likert scale. Scales are used to measure the intensity of your response. Just like the pain scale measuring the intensity of your pain, a Likert scale measures the intensity of your response. A Likert scale measures the intensity of your preference or opinion and is typically measured on a five-point scale, such as “strongly agree,” “agree,” “neither agree nor disagree,” “disagree,” and “strongly disagree.” Responses to several questions using a Likert scale are often combined to form an index. Now, you probably understand why the words “index” and “scale” are used interchangeably by many people. The word “scale” is used more frequently than “index.” Although there are differences between the two terms, the key is to understand how scales and indexes are used in criminal justice and criminology research rather than worrying about whether the research study you are reviewing used a scale or an index. Also, remember that complex concepts should be measured by numerous questions.
Assessing Reliability
In our everyday lives, we use the terms reliable and unreliable to describe our cars, friends, and technology, among others. If your car starts every time you are ready to leave, then it is reliable. If your friend never helps you when you request assistance, then he or she is considered unreliable. If your cell phone routinely drops calls, then it is unreliable. Basically, reliable, as it has been used in these examples, involves consistency. For example, does your car consistently start? As another example, if you measure your weight on your bathroom scale five times in a row and receive the same result, then the scale is a reliable measure of weight. The scale has consistently measured your weight. Stepping on your bathroom scale three times in a row and getting readings of 108, 212, and 157 pounds is inconsistent, unreliable, and as a result, not very useful.
We also use the term to describe items in criminal justice as previously mentioned. For example, if a police radar gun is used to measure the speed of two vehicles going the same speed and the same results are obtained, then the radar gun is reliable. Similarly, if a breathalyzer is administered to two individuals with the same blood alcohol level and the breathalyzer gets the same results each time, then the breathalyzer is reliable. In these cases, the radar gun is a reliable measure of the speed of automobiles, and the breathalyzer is a reliable measure of blood alcohol content (i.e., level of intoxication).
Researchers use the term in roughly the same way to describe the measures they use in their research. Reliability, from a research standpoint, addresses the consistency of a measurement. It refers to whether or not you get the same result if you use an instrument to measure something more than once. It is the researcher’s expectation that there will not be different results each time the measure is used, assuming that nothing has changed in what is being measured. When a researcher obtains different results on different measurements, then there is random error in the measurement process and the results must be evaluated with caution.
Just as with validity, there are some common ways for researchers to assess the reliability of their measures, but the assessment used depends on which aspect of reliability they are interested in. There are three different aspects of reliability that are of interest to criminal justice researchers: 1) reliability over time; 2) reliability over raters or observers; and, 3) reliability over items. The survey researcher could administer the same survey to the same respondents twice to assess consistency. This is known as test-retest reliability and is used when the researcher is interested in reliability over time. The survey researcher could have two different persons gather observations and assess the consistency between the two. This is known as interrater reliability and is used when the researcher is interested in reliability over raters or observers. Frequently, researchers assess reliability of their measures by dividing the survey into two halves and comparing the results of each half. This is known as split-half reliability and is used when the researcher is interested in reliability over items. Each of the three common ways to assess the reliability of a survey instrument is discussed in the next sections.
Test-Retest Reliability—Reliability over Time If a researcher is interested in the reliability of a survey instrument over time, she can use test-retest reliability. Utilizing test-retest reliability, a measurement is reliable over time if the same measurement is repeated using the same subjects and yields the same results. Let’s use the Scholastic Aptitude Test (SAT) as an example. If we administer the SAT to 100 high school seniors tomorrow and then administered the SAT to the same 100 seniors two days later, we would expect each student to get similar results on each test (assuming learning did not take place from the first administration to the second). If the results are quite similar, then the SAT is highly reliable; if not, then the SAT is unreliable. To assess the level of reliability of a measurement using test-retest reliability, the researcher must use the same measurement on the same subjects. If the researcher gets the same results each time, then the measurement is highly reliable and a quality measure. If the researcher gets different results each time, then the measurement has low reliability.
Since it is common for surveys to be used in cross-sectional designs (see Chapter 5), and thus, the sample only surveyed once, test-retest reliability is used infrequently to assess the reliability of a survey. However, the process is fairly easy to complete because all the researcher needs to do is give the same survey to the same subjects within a short period of time. For example, if a researcher wanted to determine the reliability of her fear of crime survey on your campus, she could administer the survey to a classroom of students on Tuesday and the same students on Thursday. If the results for each respondent are the same, then the fear of crime survey has high reliability. If the results are substantially different, then the fear of crime survey has low reliability unless something substantial has occurred on campus (e.g., a robbery and sexual assault) or in the news that can explain the substantial differences over a two-day period.
Interrater Reliability—Reliability over Raters A measurement is reliable if someone else using the same measurement in the same situation produces almost identical results. Furthermore, a measurement is reliable if the same results are obtained time after time, even when the measurement is used by different people. Consider a blood pressure cuff. If five nurses take your blood pressure within the span of a few minutes using the same blood pressure cuff and each nurse gets the same results, then the blood pressure cuff is reliable (i.e., consistent results across different raters). The raters in this example are the nurses. The five nurses arrived at the same result, so the measurement tool (i.e., blood pressure cuff) is reliable.
Interrater reliability is particularly challenging in field research (see Chapter 6) and content analysis (see Chapter 7) where there has to be substantial agreement among those who are reading and coding the documents in content analysis or observing the behavior in field research. As it applies to surveys, interrater reliability is assessed in telephone and face-to-face interviews where the interaction between the respondent and the interviewer (i.e., rater) can influence responses. In addition, when open-ended questions are used, regardless of how the survey is administered, it becomes important that the data collected are interpreted in consistent ways. If the individuals coding the data consistently agree, then interrater reliability is high.
Split-Half Reliability—Reliability over Items A popular way of determining the reliability of a survey measurement is to assess the internal consistency of the measure. This assessment is done on indexes (i.e., when a set of survey items are developed to measure some underlying concept) by comparing answers by a respondent. A measurement is reliable over items when the items contained in the index consistently measure the underlying concept. Consider the 11-question parental attachment index, previously discussed, used by Bjerregaard and Smith.26 Each of the 11 questions was designed to measure parental attachment. Low scores indicated low parental attachment and high scores indicated high parental attachment. How does a researcher determine the reliability, or what is sometimes referred to as the internal consistency, of the survey items?
Utilizing the split-half reliability technique, the researcher would split the items in half. This is accomplished by either selecting the responses to the first five questions and placing them in one group and placing the next five in another, or the odd-numbered questions and responses in one group and the even-numbered ones in another, or randomly selecting two sets of five. The researcher then compares the scores of the two halves on parental attachment for each respondent. If five of the items for a respondent indicate low parental attachment, then the other five should be consistent and also show low parental attachment. If the two halves correspond with one another over and over, then the index developed to measure parental attachment is a reliable one.
A statistic called Cronbach’s alpha is often used to assess the internal consistency/reliability of an index. The closer Cronbach’s alpha is to 1.0, the more reliable it is. The internal consistency coefficient should be at least +.60 and preferably above +.70. In an article by Bjerregaard and Smith, the authors stated, “The reliability coefficient for this scale is 0.86”27 so the measure of parental attachment was reliable. As a consumer of research you should look for an internal consistency coefficient if the researcher uses an index. Most likely what you will see is Cronbach’s alpha, which above +.70 demonstrates a reliable measure.
Increasing Reliability
One goal of a good measure is to increase question reliability. In this section, specific ways that researchers can improve the reliability of survey questions and responses will be discussed. The focus of this section is to make you an informed consumer of research regarding reliability, not describe all the nuances of question design so you can build your own survey.
Increasing Reliability: Ensuring Consistent Meaning for All Respondents One step toward increasing reliability is to make sure each respondent in a sample is asked the same set of questions. But increasing reliability is not as simple as making sure each survey respondent is asked the same questions. Each question should mean the same thing to all respondents so each respondent interprets what is being asked in the same way. Ensuring consistent meaning for all respondents leads to consistent responses to the survey questions, thus increasing reliability. If two respondents understand the question to mean different things, their answers may be different for that reason alone, which can negatively impact the results of the study. To the extent that there is inconsistency across respondents, error is introduced, and the measurement is less reliable.
One potential problem you need to assess is whether the survey includes words that are universally understood. When surveys are done on the general population, a researcher needs to remember that those sampled will have a wide range of educational and cultural backgrounds. The researcher needs to be careful in wording the questions so they are easily understood by all participants. Also, when conducting research on a criminal justice topic, the researcher needs to be careful to not use jargon and acronyms that are used in the criminal justice system. In addition, the survey researcher needs to be sure to adequately define and describe any terms that may be uncommonly used in the general population and those terms that are sometimes used incorrectly in the general population. For example, although some have a general understanding of what activities comprise certain types of crime, it is a good idea to define each crime included in a survey. It is common for people to use burglary and robbery interchangeably, but from a survey standpoint, the researcher needs to make sure that it is clear to the respondent what activity constitutes burglary and what activity constitutes robbery by defining each crime.
Besides being sure to define any unfamiliar words used in a survey, the researcher needs to be cautious when using terms or concepts that can have multiple meanings. For example, the term “recidivism” holds multiple meanings in criminal justice research. For example, recidivism is the continuation of criminal activity, but it is measured various ways in criminal justice research. In a self-report survey, recidivism can mean any subsequent criminal activity regardless of whether the offense was reported to the police or the perpetrator was arrested. Also, if a sex offender commits a theft, is he a recidivist? The answer to this question depends on how you define recidivism. Some researchers require the subsequent offense to be as serious or more serious than the original offense to be included as recidivism. Some researchers only consider reincarceration as recidivism, while others expand it to include reconvictions, and some expand it even further by including all subsequent arrests as recidivism. Since there is so much variation in how recidivism is defined and measured, a survey researcher needs to make sure the definition of recidivism is clear in the survey so all respondents will interpret the term in the same way.
What is the reliability issue with the following survey question: Do you favor or oppose gun control legislation? The problem is that respondents will interpret the term “gun control legislation” differently, so the question will not mean the same thing to all respondents. The term “gun control legislation” encompasses many legislative strategies to control guns and there is no way of knowing which strategy the respondents are thinking about while answering the question. Gun control legislation can mean banning the legal sale of certain kinds of guns such as automatic weapons, requiring people to register their guns, limiting the number of guns that people may own, limiting which people may possess guns, or implementing a waiting period before the purchase of a gun, among others. The problem is when a respondent says “yes” they favor gun control legislation, the researcher has no way of knowing which strategy is supported by the respondent. The responses cannot be interpreted without assuming what respondents think the question means. Respondents will undoubtedly interpret this question differently. As written, the question is unreliable because it does not mean the same thing to all respondents. The solution to this problem is fairly simple. The researcher should ask a separate survey question for each gun control strategy she is interested in studying. These separate specific questions will be reliable because they will be consistently understood by all respondents and interpreted by researchers. For example, one of the survey questions can be “Do you favor legislation that limits the number of guns a person may own?” This is a reliable question that will be consistently understood by all respondents.
Increasing Reliability: Additional Question Characteristics In addition to ensuring that the question means the same thing to every respondent, there are three additional characteristics of a reliable question that you should be familiar with as you assess research articles. First, in order to be a reliable question, the researcher’s side of the question and answer process is entirely scripted so that the questions, as written, fully prepare a respondent to answer questions. In face-to-face and telephone interviews, it is important to give interviewers a script so that they can read the questions exactly as worded. Second, the kinds of answers that constitute an appropriate response to the question are communicated consistently to all respondents. The respondents should have the same perception of what constitutes an adequate answer to the question The simplest way to give respondents the same perceptions of what constitutes an adequate answer is to provide them with a list of acceptable answers by using closed-ended questions. With closed-ended questions, the respondent has to choose one of a set of appropriate responses provided by the researcher. Third, a survey question should ask only one question, not two or more. For example, a researcher should not ask the question, “Do you want to graduate from college and become a police officer?” A respondent could want to do one but not the other. When asked two questions at once, respondents will have to decide which to answer, and the survey researcher will have to assume what the respondent’s answer means.
Survey Distribution Methods
A survey researcher must decide how to distribute the survey to the sample. Until the 1970s, most academic and government surveys were completed through face-to-face interviews.28 When telephone ownership became nearly universal in the United States, telephone interviewing became a common mechanism to distribute surveys.29 The newest means of survey distribution is through the Internet. There are five main mechanisms to distribute a survey: mail, group-administered, Internet, face-to-face, and telephone. Each survey distribution method will be discussed in this section. The strengths and weaknesses of each distribution method will also be discussed. Survey researchers need to consider the strengths and weaknesses of each method of distribution as they decide which distribution methods works best for their research questions and survey.
Self-Administered Surveys
Self-administered surveys involve the distribution of surveys for respondents to complete on their own. Self-administered surveys include those distributed by mail, group-administered surveys, and surveys distributed via the Internet. Self-administered surveys involve minimal (i.e., group-administered) or no personal contact (i.e., mail and Internet surveys) between the researcher and the respondent. With self-administered surveys, surveys can be mailed to the sample, distributed to a large group of people in one location, or can be sent through e-mail or placed on the Internet. One of the main advantages of self-administered surveys is that the collection of sensitive, stigmatizing, and embarrassing information is more likely to be valid, as previously discussed, since respondents do not have to share their responses directly with an interviewer. However, one of the main disadvantages is that there may be a discrepancy between what people report they do and what they actually do, as previously discussed when the topic of social desirability was addressed. A survey researcher must weigh the strengths and weaknesses of each type of self-administered survey when determining the best method of distribution for their survey.
Mailed Surveys Since only a valid mailing address is required, a common method to distribute surveys is to mail the survey to the sample.
The major strengths of mail surveys are listed below.
1. Mail surveys are fairly inexpensive to complete. Since there are no interviewers to pay, the costs of a mail survey are typically much lower than a face-to-face or a telephone interview. The main cost is the printing and mailing of the surveys and the return postage for the survey responses. In addition, mail surveys can be accomplished with minimal staff and office space.
2. Mail surveys can be easily distributed to a geographically dispersed sample.
3. Mail surveys provide respondents ample time to give thoughtful answers and even to refer to other documents that may be needed to answer the survey questions.
The major weaknesses of mail surveys are listed below.
1. Mail surveys typically have lower response rates than other methods of survey distribution.
2. Mail surveys require complete and easy-to-understand instructions since there is no personal interaction between the survey researcher and the respondent. If the instructions are unclear or the survey questions are confusing to the sample, the researcher will face significant reliability issues, which will impact the results of the study as previously discussed.
3. With mail surveys, the researcher has no control over who actually completes the survey. The survey researcher may restrict the survey to only adults between the ages of 18 and 35, but that does not necessarily reflect who actually answered the survey.
RESEARCH IN THE NEWS
Survey Shows More Teens Using Synthetic Drugs30
Nearly one in nine high school seniors have gotten high in the past year on synthetic drugs, such as K2 or Spice, second only to the number of teens who have used marijuana, according to the Monitoring the Future survey. The survey, conducted annually by the University of Michigan, questions 47,000 students in the 8th, 10th, and 12th grades in 400 public and private schools throughout the United States. The survey is group-administered to students in their normal classrooms. It is sponsored by the National Institute of Drug Abuse and the National Institutes of Health.
Monitoring the Future, the nation’s most comprehensive survey of teenage drug use, found 11.4% of the high school seniors have used the synthetic substances, often packaged as potpourri or herbal incense and sold in convenience stores, which mimic the effects of marijuana. K2 and Spice emerged as a problem in 2008, and their popularity appears to be rising. People who smoke the chemical-coated herbs may experience euphoria, but bad reactions are common, including convulsions, anxiety attacks, dangerously elevated heart rates, vomiting, and suicidal thoughts. Most teens who smoke Spice or K2 report using other illicit drugs.
Marijuana remains the most popular drug among teens. Marijuana use increased for the fourth year in a row after a decade of decline. Nearly 7% of high school seniors report smoking marijuana daily, which is the highest rate seen in 30 years. In addition, half of high school seniors reported having tried an illicit drug at some time, 40% reported using one or more drugs in the past year, and a quarter said they had used one or more drugs in the past month, the survey found. Tobacco and alcohol use are at their lowest levels since the survey began in 1975.
Group-Administered Surveys Surveys can be distributed to individuals who have gathered together in a group. In fact, you have probably participated in a group-administered survey in one of your college classes. It is common for surveys to be administered to students in college and high school classrooms as well as to professionals in the criminal justice system who have gathered for in-service training or conference participation. The researcher will address the group regarding the purpose of the survey and to request participation. The researcher will then hand out the survey to each member of the group. The survey participants will typically complete the survey at the time of distribution and immediately return it to the researcher.
The major strengths of group-administered surveys are listed below.
1. Response rates are typically very high.
2. Since the researcher is at least present, he has the opportunity to explain the study and answer questions respondents may have about the survey.
3. Generally, group-administered surveys are inexpensive to complete since numerous surveys can be completed and returned at one time.
The major weakness of group-administered surveys is that it only applies to the small number of participants than can be easily gathered as a group. It is practically impossible to have a random sample of community residents gather to take a survey. However, some groups of people naturally congregate (e.g., students and prisoners), making group-administered surveys a viable means of survey distribution for some populations.
Internet and E-mail Surveys A recent development in survey distribution is to send an e-mail invitation to the sample. The selected subjects are then asked to answer questions by replying to a survey that is included in the e-mail or they are provided a link to a website where the survey can be completed online. Several commercial companies (e.g., Survey Monkey) make the process of creating, distributing, and collecting and coding data from an Internet survey easy and affordable. Although Internet and e-mail surveys are fairly new, the process and challenges mirror those for mail surveys.
The major strengths of Internet and e-mail surveys are listed below.
1. Internet and e-mail surveys are inexpensive to complete. The researcher does not even incur the printing, postage, and data entry costs associated with a mail survey.
2. The data from Internet and e-mail surveys can be collected quickly. An e-mail survey can be distributed instantaneously to hundreds of email addresses and since the survey is answered online, there is no delay in the researcher obtaining the completed survey. Once the respondent hits “submit” or “send” the researcher obtains the completed survey immediately.
The major weaknesses of Internet and e-mail surveys are listed below.
1. Internet and e-mail surveys are limited to individuals with e-mail addresses and Internet access. There are variations in computer ownership and use by race, ethnicity, age, income, and education, which can significantly impact the generalizability of results.
2. Depending on the sampled group and the topic, response rates to Internet and e-mail surveys are frequently low. A significant problem with Internet and e-mail surveys is inducing people to respond to the survey since there is no personal interaction between the researcher and potential respondent.
Personal Interviews
Surveys are often conducted by interviewers who read the survey items to respondents and record their responses in a face-to-face or telephone interview. A persistent issue with interviews involves the reliability (i.e., consistency) of the responses. Since there is a personal interaction between the interviewer and the respondent, the interviewer may influence the responses provided to the questions, which impacts the interrater reliability of the study. Different interviewers obtain somewhat different answers to the same questions. The interviewer’s style and personal characteristics (such as gender, race, and age) can impact the answers provided by respondents. Also, since the survey questions are read to the respondent, the interviewer’s tone and body language can lead to a different meaning to the question for different respondents. As discussed in the reliability section of this chapter, it is critical to the reliability of survey questions and responses that the questions mean the same thing to all respondents. The way certain questions are phrased by different interviewers can impact the responses given, thus impacting the reliability of the study. It is critical that interviewers are trained prior to data collection and monitored throughout the interview process so inconsistencies between interviewers can be minimized.
Face-to-Face Interviews Face-to-face interviews are typically completed in the respondent’s residence. Recall from the opening case study that the initial interview of the National Crime Victimization Survey is completed face-to-face.
The major strengths of face-to-face interviews are listed below.
1. Surveys which utilize face-to-face interviews typically have high response rates.
2. Lengthy surveys can be completed through face-to-face interviews. Although it is not always the case, some face-to-face interviews take more than one hour to complete.
3. The interviewer can answer any questions the respondent may have and can probe for additional information when an inadequate or incomplete answer is provided.
The major weaknesses of face-to-face interviews are listed below.
1. Due to the cost of interview staff and perhaps travel to the interview locations, face-to-face interviews are typically the most expensive survey distribution method.
2. The amount of time it takes to complete all the face-to-face interviews means that the data collection period is usually longer than other methods of survey distribution.
Telephone Interviews Telephone interviews are usually completed through the use of a computer-assisted telephone interviewing (CATI) system. With CATI, the interviewer reads the question from a computer screen and then enters the respondent’s answer directly into the CATI software so it is readily available for analysis. The CATI system then automatically shows the next question on the computer screen. This process increases the speed with which interviews are completed and reduces interviewers’ errors. Telephone interviews are less expensive, less time consuming, and less subject to the reliability threats that can occur when conducting face-to-face interviews.
The major strengths of telephone interviews are listed below.
1. The telephone interviewing process can be completed very quickly. A staff of 15 interviewers can complete over 1,000 telephone interviews in a few days.
2. Through the use of random digit dialing (RDD), probability sampling can be utilized in telephone interviews. RDD is used because a large percentage of household telephone numbers are not listed in the current telephone book, either because they are new or at the request of the customer. RDD offers each telephone number an equal probability of being selected, which is required in probability sampling, by randomly generating the last four digits of each telephone number selected in the sample.
The major weaknesses of telephone interviews are listed below.
1. Even though RDD is used, there are sampling limitations with telephone surveys because many people do not have landline telephones. According to the 2011 National Health Interview Survey, 36.8% of the respondents did not have a working landline telephone in their home, up from 20% in 2008.31 Furthermore, 31% of the respondents stated they receive all or almost all of their calls on cell phones.32 People without landline phones and those who only use cell phones are generally excluded from RDD sampling. This limits the generalizability of findings generated from RDD samples.
2. In addition to the rise of cell phone use, telephone survey response rates suffer from the increased use of caller ID, which has decreased the rate at which people answer their landline telephones. Also, because many telephone calls are for sales and fundraising purposes, some people react negatively to calls from strangers, which further reduces the response rates for telephone surveys.33
Which Method of Survey Distribution Should a Researcher Use?
It would be much easier if we just said that there is one preferred method of survey distribution, but the reality is that a survey researcher needs to consider his research questions, survey structure, population under study, and the strengths and weaknesses of each method of distribution in deciding which is best for his research project. For example, when the researcher has a limited budget, one of the self-administered techniques (i.e., mail, group-administered, Internet, and e-mail surveys) is preferable. Numerous Ph.D. dissertations in criminal justice and criminology have utilized self-administered surveys because of their low cost. However, self-administered surveys are not a good option if the researcher is concerned about the reading and writing capabilities of the sample members. Furthermore, self-administered surveys are not a good option when the survey consists of several open-ended questions. Personal interviews are more appropriate for several open-ended questions while self-administered surveys should include almost exclusively closed-ended questions. There is no simple answer to the stated question at the start of this section. The researcher needs to consider the research question and survey and then needs to maximize the strengths and minimize the weaknesses of the chosen survey distribution method.
Chapter Summary
This chapter began with a brief overview of the three main components of survey research (i.e., sampling, question design, and methods of survey distribution) followed by a discussion of nonresponse and its impact on survey results. Comprehensive discussions of validity and reliability followed. The four ways of assessing the validity of survey questions and responses were illustrated, including face validity, content validity, criterion-related validity, and construct validity. Preferred mechanisms to increase the validity of embarrassing and stigmatizing questions as well as to control for social desirability bias were explained. For reliability, the three main mechanisms to assess reliability (i.e., test-retest reliability, interrater reliability, and split-half reliability) were presented as well as mechanisms to increase reliability such as ensuring consistent question meaning for all respondents. Finally, the methods of survey distribution were presented along with the strengths and weaknesses of each.
Critical Thinking Questions
1. What are the three categories of nonrespondents, and how does nonresponse impact survey results?
2. What are the main ways to assess validity, and what strategies exist to increase the validity of survey questions and responses?
3. What are the main ways to assess reliability, and what strategies exist to increase the reliability of survey questions and responses?
4. What are the strengths and weaknesses of each survey distribution method?
Key Terms
construct validity: Assesses the extent to which a particular measure relates to other measures consistent with theoretically derived hypotheses concerning the concepts/variables that are being measured
content validity: When the survey questions measure the full breadth and depth of the concept being studied
criterion-related validity: An assessment to determine the strength of the relationship between the responses to the survey and another measurement, the criterion, to which it should be related if the measurement is valid
Cronbach’s alpha: A statistic used to assess the internal consistency/reliability of an index
face validity: An assessment of the survey questions to see if on “face value” the questions seem to be measuring the concepts and variables they are supposed to be measuring
index: A set of items that measure some underlying concept
interrater reliability: A ratio established to determine the agreement among multiple raters
reliability: Addresses the consistency of a measurement and refers to whether or not a researcher gets the same results if the same instrument is used to measure something more than once
response rate: The number of people who respond to a survey divided by the number of people sampled
scale: A set of questions that are ordered in some sequence
self-administered surveys: The distribution of surveys for respondents to complete on their own; includes surveys distributed by mail, group-administered surveys, and surveys distributed via the Internet
social desirability bias: When respondents provide answers to survey questions that do not necessarily reflect the respondent’s beliefs but instead reflect social norms
split-half reliability: An assessment of reliability in which the correspondence between two halves of a measurement is determined
telescoping: When a respondent brings behaviors and actions that occurred outside the recall period into the recall period
test-retest reliability: An assessment of reliability in which a measurement is reliable over time if the same measurement is repeated using the same subjects and yields the same results
validity: Addresses the accuracy of the measurement and refers to the extent to which researchers measure what they planned to measure
Endnotes
1 Truman, Jennifer L. (September 2011). Criminal victimization, 2010. Washington D.C.: Bureau of Justice Statistics.
2 Fowler, Floyd J., Jr. (2009). Survey research methods, 4th ed. Thousand Oaks, CA: Sage.
3 Ibid.
4 Ibid.
5 Ibid.
6 Ibid.
7 Truman, September 2011.
8 Fowler, 2009.
9 Earl Babbie. (2013). The practice of social research, 13th ed. Belmont, CA: Wadsworth.
10 Wilsnack, R. “Explaining collective violence in prisons: Problems and possibilities.” 61–78 in Cohen, A., G. Cole, and R. Bailey. (1976). Prison violence. Lexington, MA: Lexington Books. This study was excerpted from Amy B. Thistlethwaite and John D. Wooldredge. (2010). Forty studies that changed criminal justice: Explorations into the history of criminal justice research. Upper Saddle River, NJ: Prentice Hall.
11 Sykes, G. (1958). The society of captives: A study of a maximum security prison. Princeton, NJ: Princeton University Press.
12 Henderson, J., W. Rauch, and R. Phillips. (1987). Guidelines for developing a security program, 2nd ed. Washington D.C.: National Institute of Corrections, NIC Accession Number 006045.
13 Useem, B., and A. Piehl. (2006). “Prison buildup and disorder.” Punishment and Society 8, 87–115.
14 Fowler, 2009.
15 Rosenberg, M. (1965). Society and the adolescent self-image. Princeton, NJ: Princeton University Press.
16 ICPSR can be accessed at http://www.icpsr.umich.edu/icpsrweb/ICPSR/
17 Maltais, Michelle. (July 9, 2012). “Want a job? Check the spelling on your Facebook profile.” Los Angeles Times. http://www.latimes.com/business/technology/la-fi-social-recruiting-jobs-20120709,0,2693929.story. Retrieved on July 10, 2012.
18 Fowler, 2009.
19 Ibid.
20 LaPiere, Richard T. (1934). “Attitudes vs. actions.” Social Forces 13, 230–237.
21 Jacobs, J., and L. Kraft. (1978). “Integrating the keepers: A comparison of black and white prison guards in Illinois.” Social Problems 23, 304–318. This study was excerpted from Amy B. Thistlethwaite and John D. Wooldredge. (2010). Forty studies that changed criminal justice: Explorations into the history of criminal justice research. Upper Saddle River, NJ: Prentice Hall.
22 Jacobs and Kraft, p. 317.
23 Jurik, N. (1985). “An officer and a lady: Organizational barriers to women working as correctional officers in men’s prisons.” Social Problems 32, 375–388.
24 Bjerregaard, Beth, and Carolyn Smith. (1993). “Gender differences in gang participation, delinquency, and substance use. Journal of Quantitative Criminology 9, 329–355.
25 Hudson, W. (1982). The clinical measurement package: A field manual. Homewood, IL: Dorsey Press.
26 Bjerregaard and Smith, 1993.
27 Bjerregaard and Smith, 1993, p. 339.
28 Fowler, 2009.
29 Ibid.
30 Leger, Donna Leinwand. (December 14, 2011). “Survey: More teens using synthetic drugs.” USA Today. http://www.usatoday.com/news/nation/story/2011–12–14/more-teens-using-synthetic-drugs/51900736/1. Retrieved on June 15, 2012.
31 http://www.cdc.gov/nchs/nhis/quest_data_related_1997_forward.htm. Retrieved on July 12, 2012.
32 Ibid.
33 Fowler, 2009.
