
2 Fabric Analysis
Introduction
Purpose
Compare fabric samples via TLC of dye extracts and ATR-FTIR.
Forensic Fabric Analysis
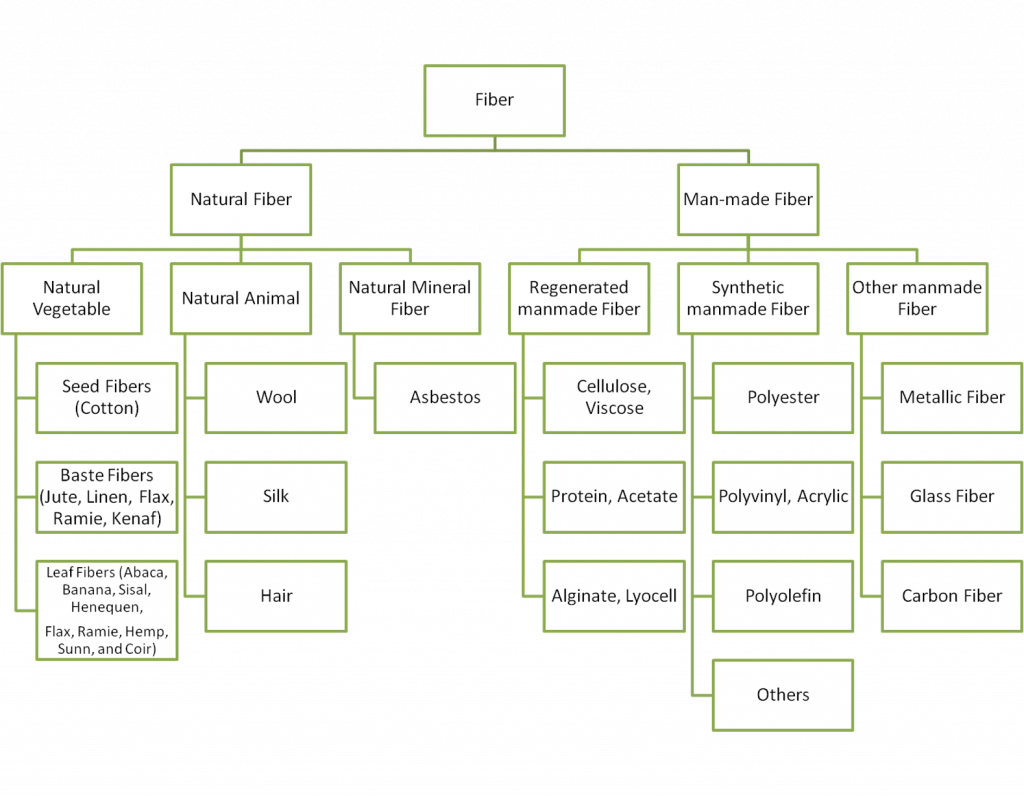
Fabrics are woven (pun intended) into nearly every part of our lives. Clothes, towels, car seats, blankets, rugs, etc. and fibers from these items and more are often collected as evidence when a crime has been committed. Fibers and fabrics can be made of natural, manufactured, or inorganic materials (see Figure 1). Natural fibers can be categorized as either animal (e.g., wool) or vegetable (e.g., cotton). Manufactured fibers can be categorized as either synthetic (e.g., nylon), regenerated or semisynthetic (e.g., rayon), or inorganic (e.g., glass). Mineral fibers is a third major classification of fibers which includes asbestos, but these are more rare now that most uses of asbestos have been abolished.
Most fabrics we interact with on a daily basis are dyed or sometimes pigmented. Dyes are organic compounds that absorb and reflect certain wavelengths of light, while pigments are insoluble, often inorganic, particles either incorporated into a man-made fiber while it's being made or bonded to the surface afterwards. Some material and dye combinations, like white cotton or indigo cotton (from blue jeans), are generally considered so ubiquitous as to eliminate almost all discriminatory or comparative utility (note - these fabrics may still be useful if they are a source of hair, DNA, other chemical evidence). In other instances, though, we may be able to use details of fabric material and dye composition to compare fibers to a fabric associated with a suspect, victim, location, etc.
There are a number of methods that can be used to compare fabric and fiber samples. A visual examination and some combination of microscopy techniques will first be used to determine if the fabric is animal, vegetable, or some synthetic material, measure the cross section of fibers, evaluate optical properties, etc. Other nondestructive instrumentation like UV-Vis microspectrophotemetry (color comparison) and FTIR (synthetic composition analysis) may also be used. Then, if there is enough material and further discrimination is required, destructive methods such as solubility tests to glean compositional information, thin layer chromatography on extracted dyes, or pyrolysis-GC-MS to identify synthetic materials may be used.
Solubility Testing
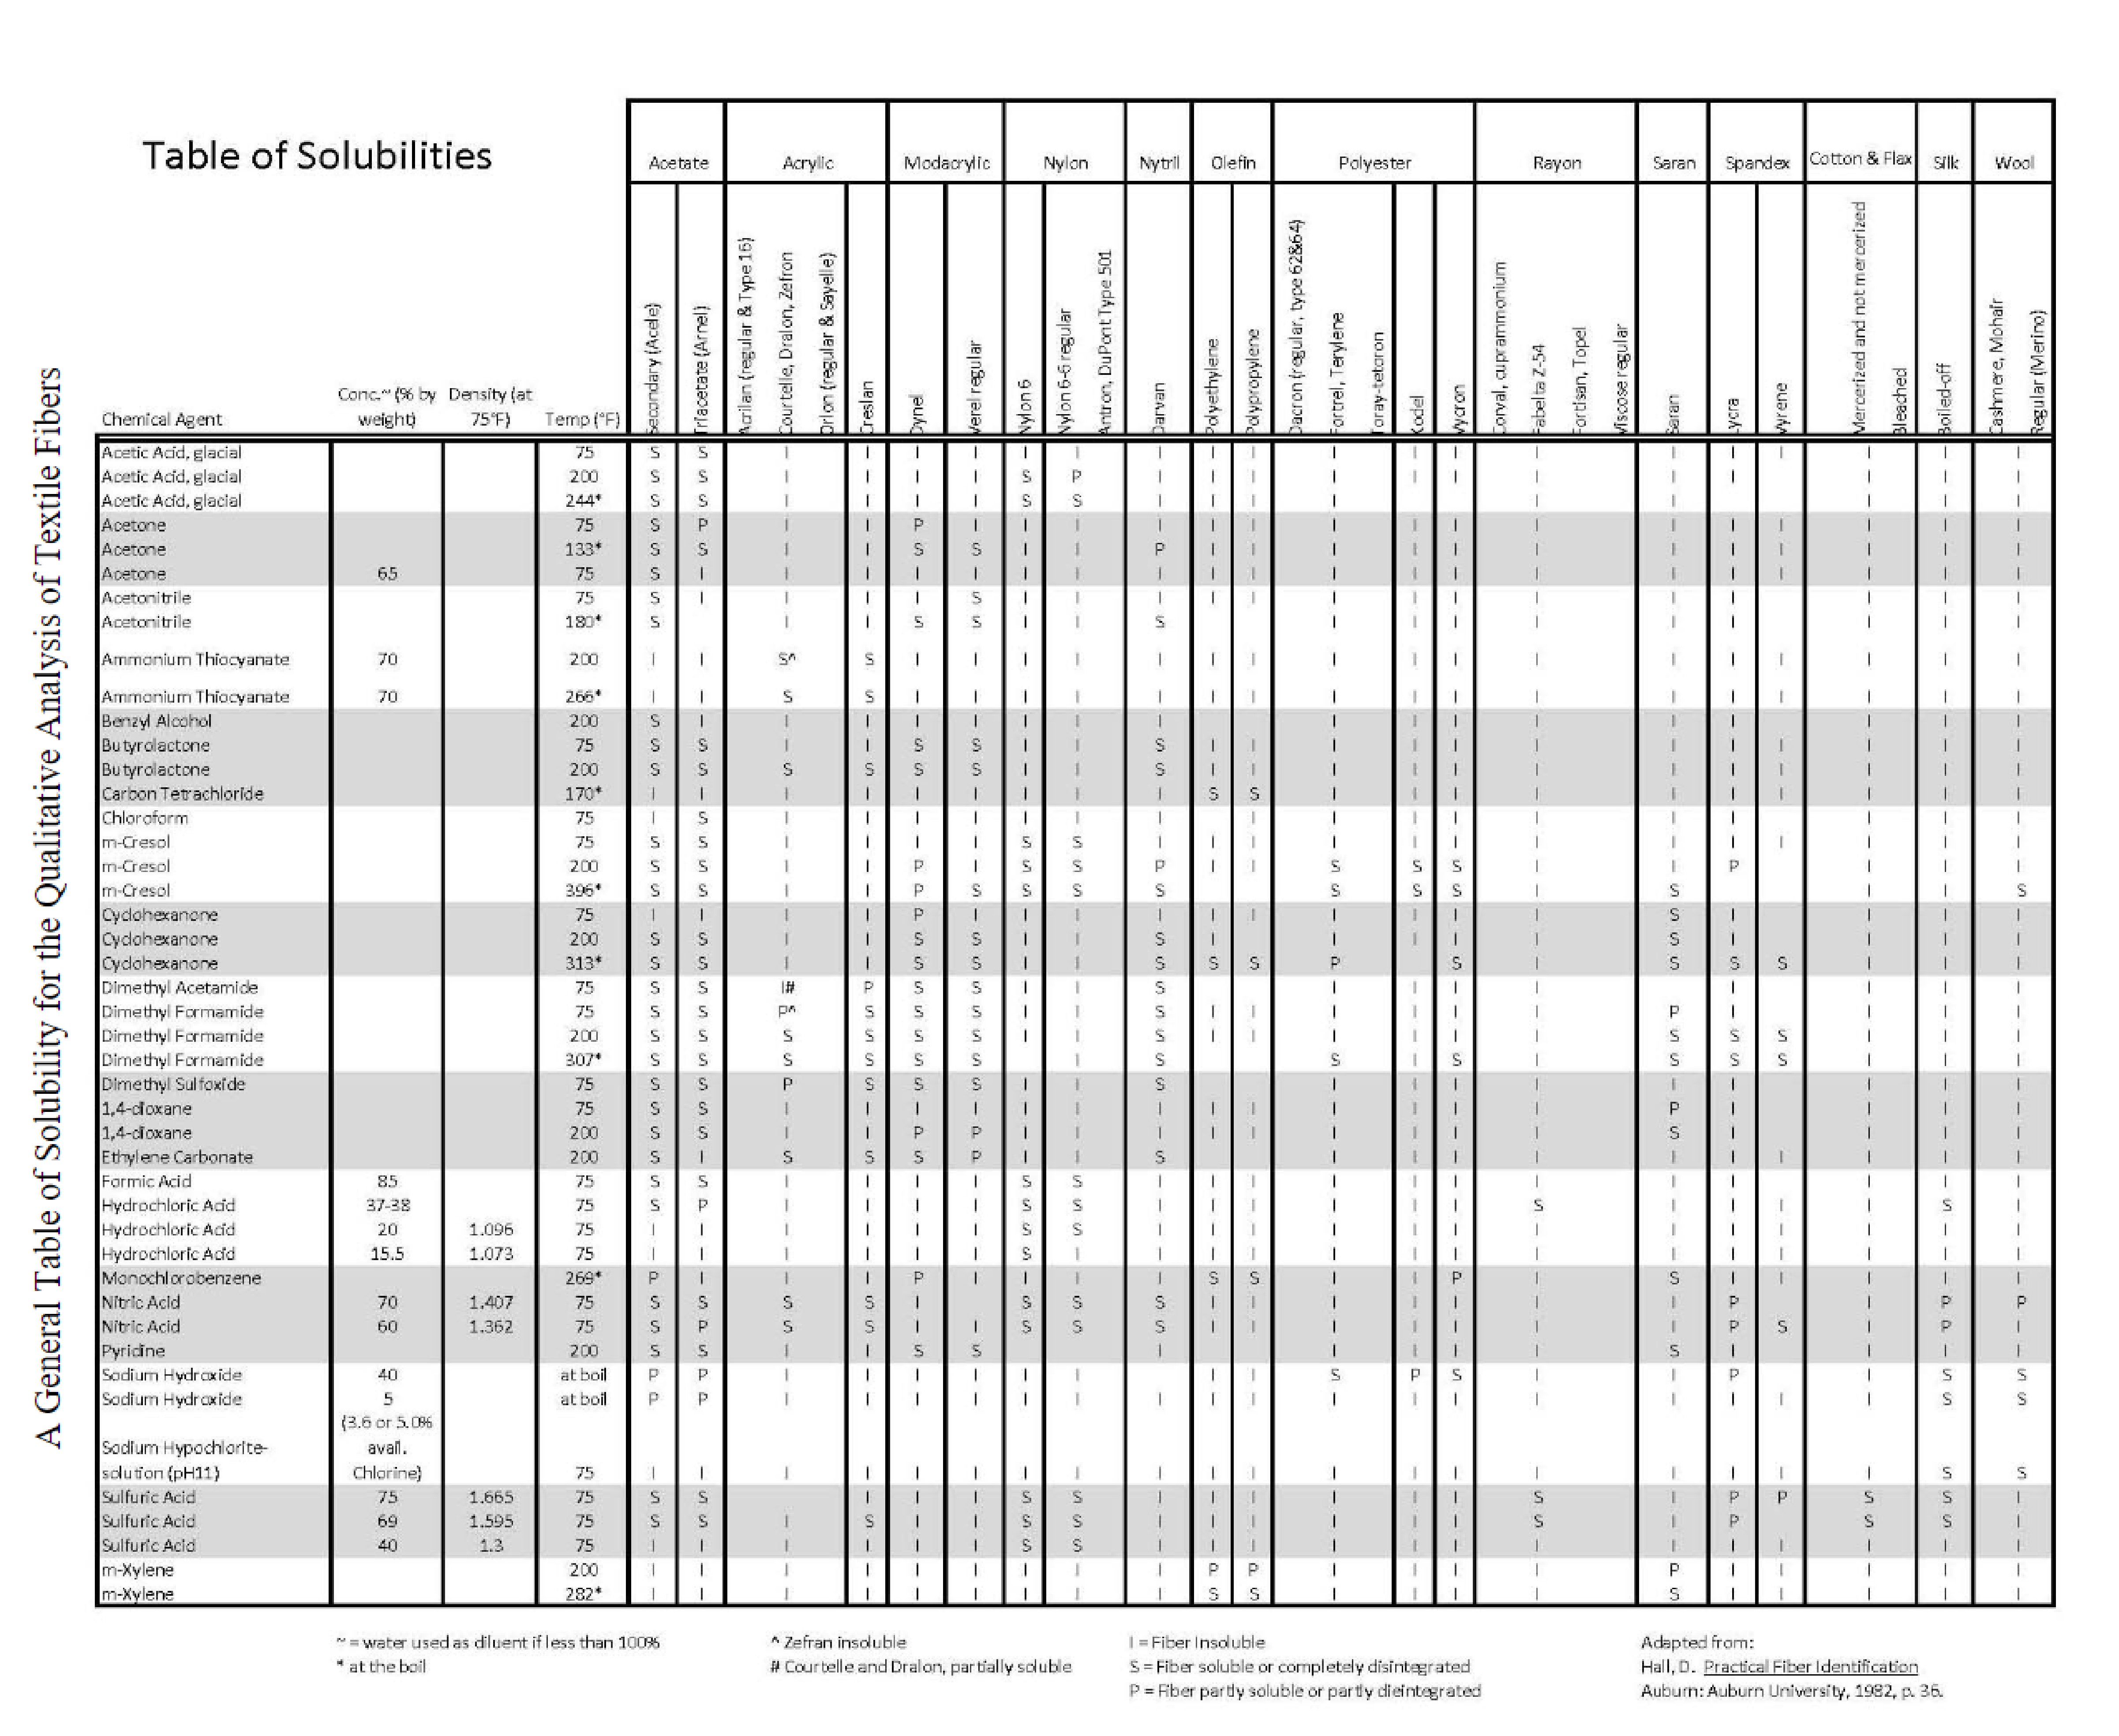
By placing small pieces of fabric in a variety of solvents, we can compare solubility to determine its composition. A couple of common solvents used are acetonitrile and butryolactone. Acetonitrile can differentiate between acetate (soluble) and triacetate (insoluble). Butyrolactone can differentiate between acrylic (insoluble) and modacrylic (soluble). In many cases, enough evidence may not be present to test more than one or two solvents, if that, but many others have been investigated. See the table used by the North Carolina State Crime Laboratory in the Appendix (or click here to download) for additional fiber solubilities. Some of these require heating, but we will not use any of those in this exercise.
Thin Layer Chromatography (TLC)
While TLC is not useful for identification or confirmatory comparisons, it is still quite useful as a fast, cheap separation and visualization method for comparing unknown samples from a crime scene with reference samples we collect from known sources. TLC uses a thin stationary phase like silica adhered to a rectangular plate that is usually made of glass or aluminum. After placing small spots of our sample (in this case, dye extracted from fabric) near the bottom of the stationary phase, we place the plate in a small amount of solvent (the mobile phase) and allow capillary action to draw solvent up the stationary phase. As the solvent moves up the plate, it will carry and separate components of each sample based on their affinity for both the mobile phase and stationary phase. Analytes that have greater affinity for the mobile phase will travel a greater distance up the plate than those that have a greater affinity for the stationary phase.
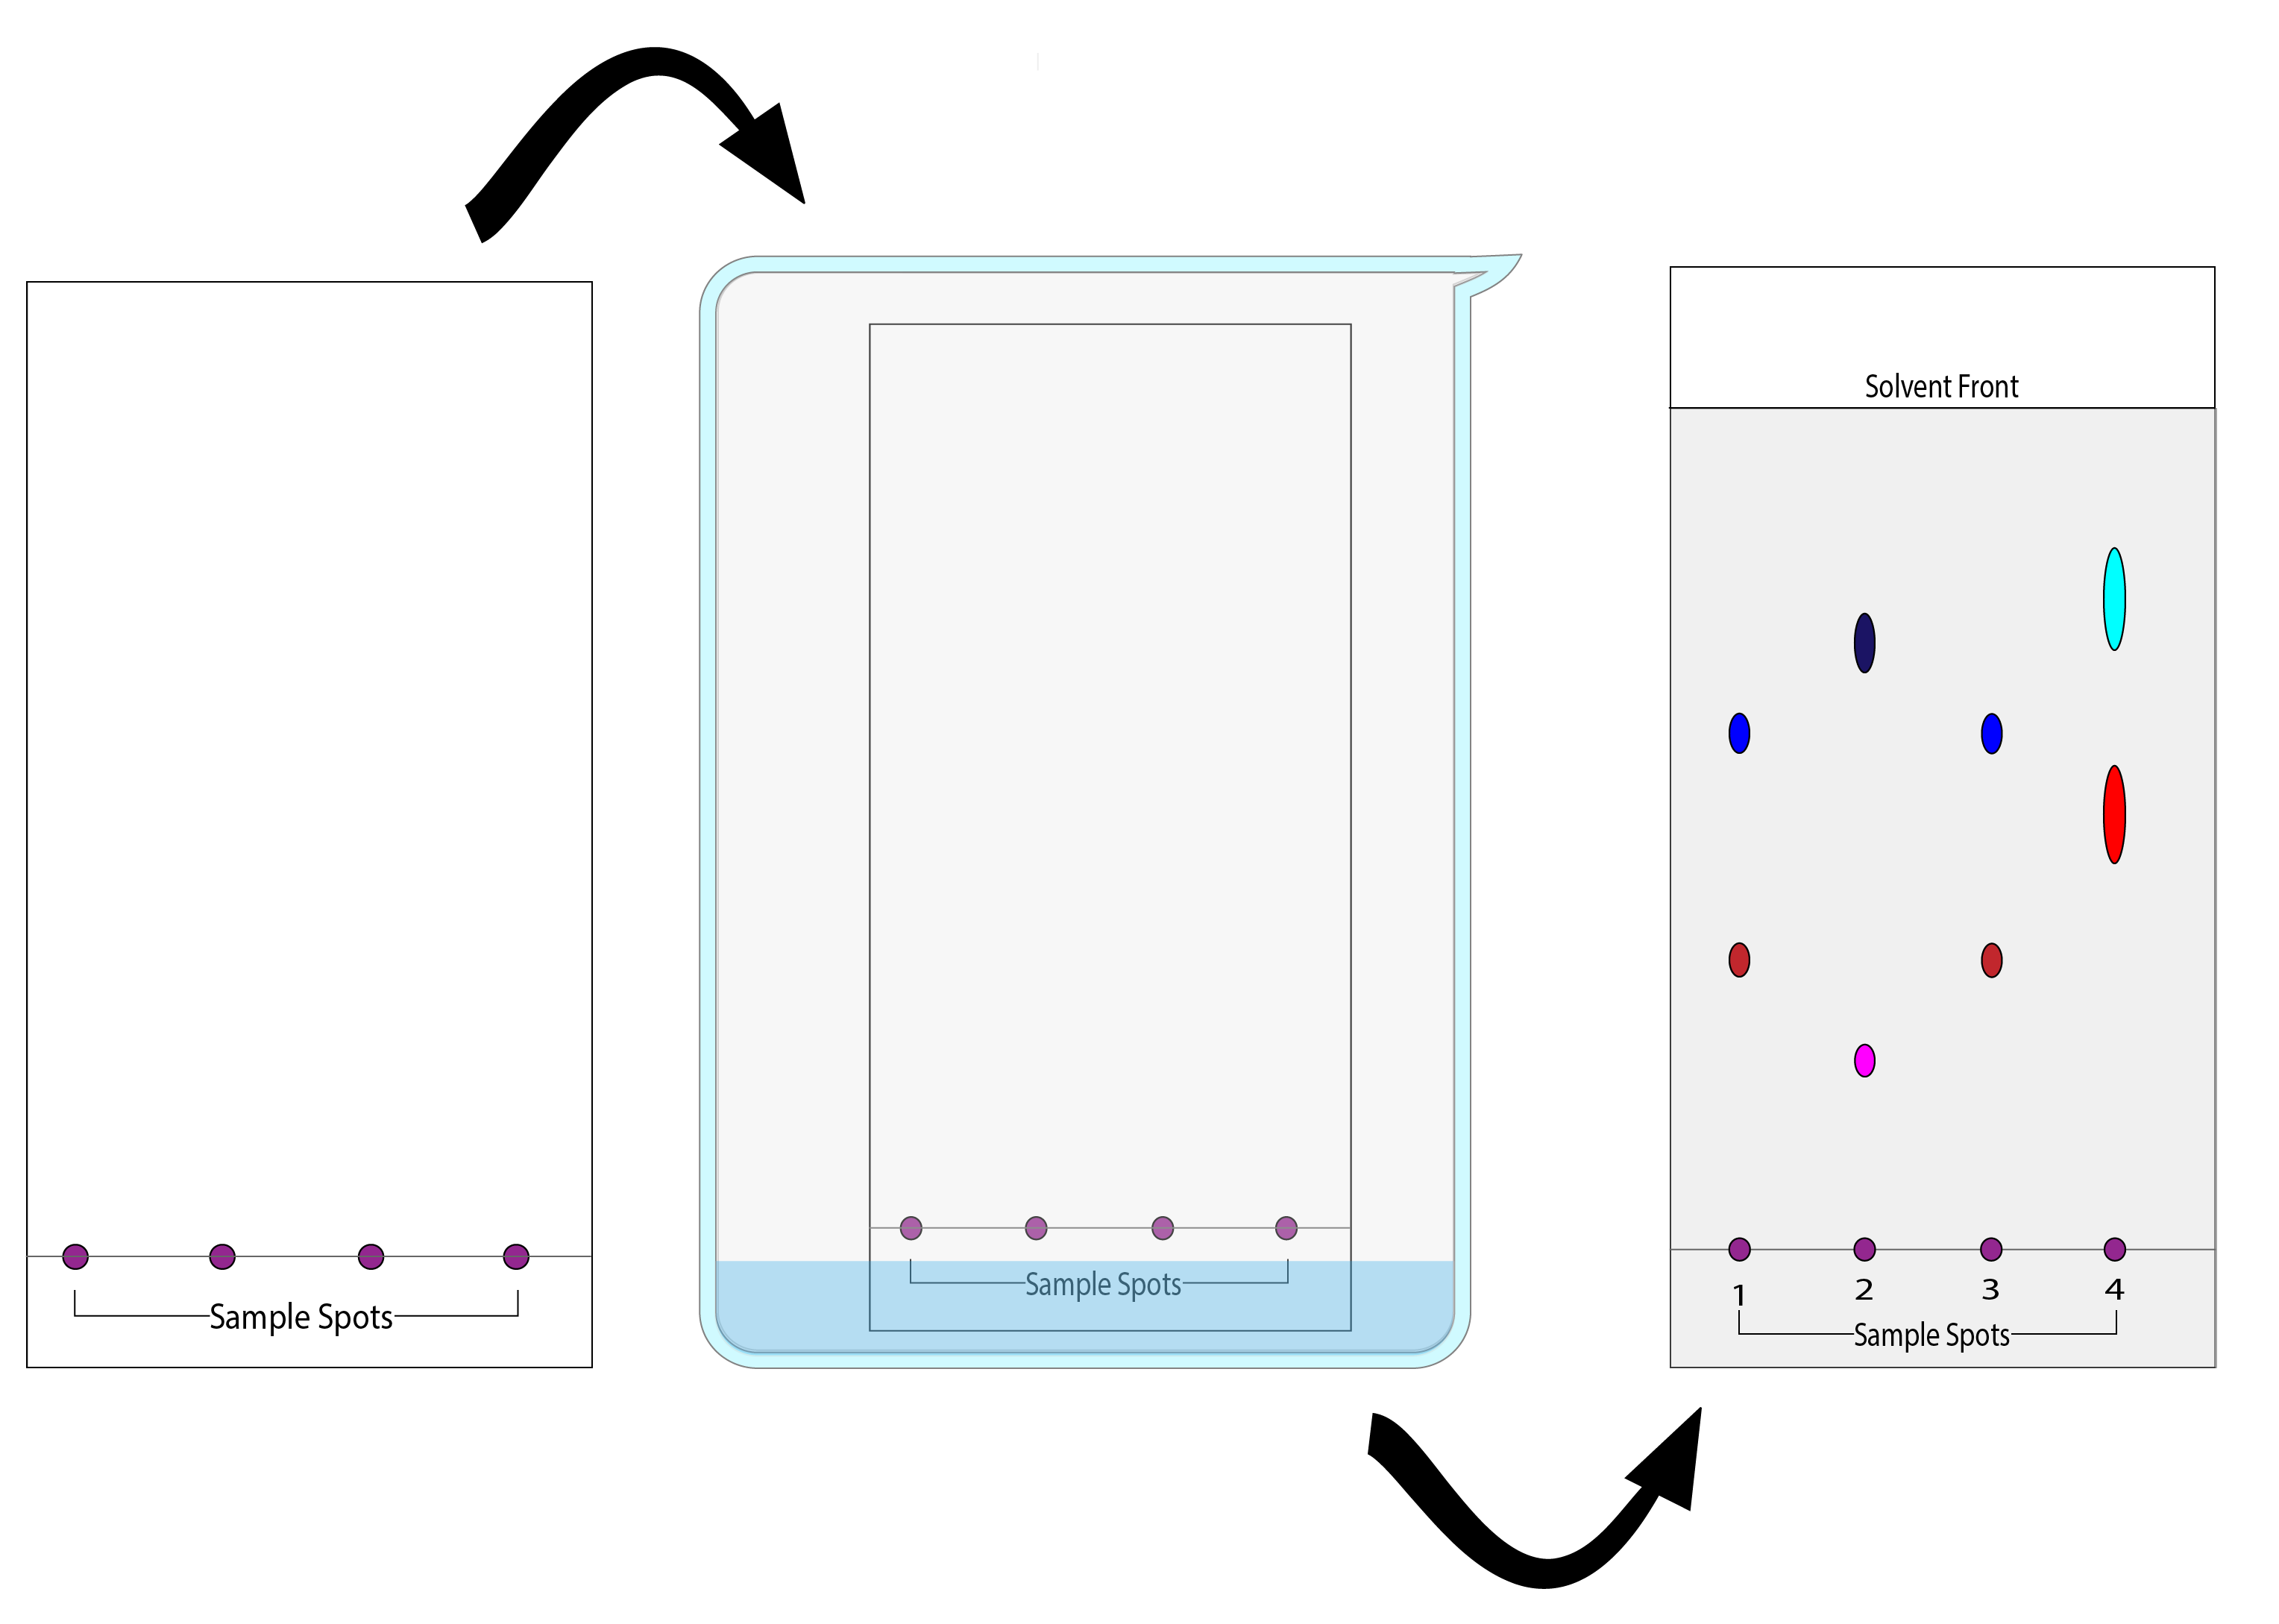
Figure 2 shows a TLC plate with 4 sample spots being placed in a beaker with a small amount of solvent. It's then removed when the solvent front reaches about 1-2 cm from the top end of the plate. We can compare the eluted components by calculating the retention factors (Rf) of each spot and by exposing the plate to an alternate light source. This is done by measuring the distance from the starting line to the center of the spot and dividing it by the distance from the starting line to the solvent front.
Retention factor (Rf): 
Dye Extraction
Before we can hope to get useful information from a TLC experiment, we have to have samples to spot in the first place. In the case of fabric and fiber analysis, that means extracting the dye. There are many dye classes and methods for applying them to various fibers. In Tables 2-4 below, some extraction and elution systems have been summarized - this is by no means exhaustive but includes common combinations and does not include dye classes which are not extractable.
| A | Pyridine / Water (4:3) |
| B | Glacial acetic acid |
| C | 2% Aqueous Oxalic Acid |
| D | Formic Acid / Water (1:1) |
| E | Dimethylformamide / Formic Acid (1:1) |
| 1 | n-Butanol, acetone, water, ammonia (5:5:1:2) |
| 2 | Pyridine, amyl alcohol, 10% ammonia (4:3:3) |
| 3 | n-Butanol, ethanol, ammonia, pyridine, water (8:3:4:4:3) |
| 4 | Methanol, amyl alcohol, water (5:5:2) |
| 5 | Toluene, pyridine (4:1) |
| 6 | Chloroform, ethyl acetate, ethanol (7:2:1) |
| 7 | n-Butanol, acetic acid, water (2:1:5) - use upper phase |
| Select Common Fiber Types | Step 1 | Dye Class (if Step 1 yields good extraction) | Step 2 (If no/poor extraction in Step 1) | Dye Class (if Step 2 yields good extraction) | Suggested Elution Systems |
| Wool | A | Acid | C | Metallized | 1, 2 |
| Cotton & Viscose | B | Azoic | A | Direct | 1, 3, 4 |
| Polyester | A | Basic or Disperse | E | Basic | 5, 6 |
| Nylon | A | Acid or Basic (may differentiate during TLC) | - | - | 7 |
| Polypropylene (dye may not extract)* | A | Acid | - | - | *If extraction is achieved, use 1 |
| Acetate / Triacetate | A | Disperse | - | - | 5, 6 |
| Acrylic | D | Basic | - | - | 1 |
Pre-Lab Questions
- Referring to Figure 2 in the Introduction of this Exercise, calculate the retention factors (Rf) of each spot on the TLC plate.
- Compare and contrast the samples. Do any warrant further analysis?
- Calculate how much of each reagent you'd need to make the 10 mL of Extraction Solutions A and C from Table 2.
Materials and Methods
Supplies (Part 1)
- Fabric evidence
- Fabric reference samples (TA provides)
- Reagents for solubility test
- Extraction solvent reagents
- Test tubes for extraction
- Permanent markers
- Scissors
Procedure (Part 1)
Visual Examination
- Carefully open your evidence with gloved hands
- To properly open evidence, be sure to open the bag away from the original seal
- Note observations such as color, size, etc.
- Take photos of each sample
Solubility Test
- Place a small piece of fabric into a small labeled test tube
- Add enough acetonitrile or other solvent per TA instruction to cover the sample
- Note observations such as soluble, partly soluble, or insoluble
- Try at least 2 solvents per sample if enough sample is available
- Take photos of each attempt
Extract Dye from Unknown Sample
- Heat a beaker of water on a hot plate to ~90-100°C
- Place pieces of the reference fabrics into their own labeled test tubes
- Add 0.5 mL of your first chosen extraction solvent to each test tube
- Note the time you add solvent to each sample
- Suspend the test tubes inside the water bath
- Allow the extraction to take place for 15-20 minutes
- Be sure that the solvent doesn't completely evaporate
- Remove the fabric pieces from the tubes after the same duration of time to prevent differential extraction times
- A dye extraction will be apparent if the solvent has significantly changed color
- If it has not, consult Tables 2 and 3 to choose another extraction solution
- Take photos of each attempt and end results
- Seal your test tubes until you're ready for Part 2
Supplies (Part 2)
- Dye extractions from Part 1
- Elution solvent
- TLC supplies - plate, reservoir, capillary spotters, filter paper
- Pencil
- Ruler
- Light source
Procedure (Part 2)
Prepare TLC Plate
- Carefully handle your TLC plate only touching the back or edges and not the stationary phase
- Draw a faint line in pencil approximately 1 cm from one short end of the TLC plate
- Label equidistant spots with a 1-2 character notation that you can associate with your samples (U for unknown, R1 for reference 1, for example)
- Stay at least 5 mm from the edge of the plate
- Using capillary spotters, carefully spot SMALL amounts of each extraction sample onto the line above their respective labels
- 2 mm or less diameter spot is ideal
- Use a quick but gentle vertical motion to spot your sample - be careful not to gouge the stationary phase
- It's recommended to grab a paper towel and practice spot on that a couple of times first
- Allow the spots to dry while you prepare your TLC chamber
Prepare TLC chamber
- Place enough of the pre-made elution solvent obtained from TAs to cover less than 1 cm of the bottom of the chamber (volume may vary depending on size)
- Place some filter paper into the chamber off to one side to maintain eluent vapors within the chamber
- Place lid (or watch glass) onto chamber and gently tilt to saturate the filter paper
Compare Extractions with TLC
- Once the spots on the TLC plate are dry, gently place your plate into your chamber using clean forceps
- Place the lid or watch glass back onto the chamber and monitor
- When solvent front has reached ~1 cm from the top of the plate, you may remove it
- Immediately mark the solvent line with a pencil
- Measure the distance from the solvent front to the starting line
- Take a photo of the finished plate
- Measure any visible spots from starting line to center of the spot and calculate Rf values
- Using appropriate eye protection, view the plate with an alternate light source
- If additional spots appear, measure their Rf values as well
- Note if any of the reference samples can be excluded or a possible match for further analysis
Supplies (Part 3)
- Fabric evidence
- Fabric reference samples (TA provides)
- ATR FTIR
Procedure (Part 3)
Analyze Unknown and Reference Samples
- Once the instrument is ready to use, clean the crystal area where you will place your sample
- Place your first sample on the crystal area
- Position the pressure arm over the sample and analyze the sample
- If the signal is not strong enough, the pressure arm may need to be adjusted
- Repeat for all samples indicated by your TA
- Be sure to note any particular methods or instructions given by your TA
- Obtain CSV or TXT files for all of your spectra
- TA may put this on Canvas
- These can be imported into Excel - not only can we then manipulate the data if needed, the figures will also look much nicer than a screenshot
- In Excel: click 'Data', 'From TXT/CSV', select the file, make sure the data is split into cm-1 and %T columns (change delimiter if not), click 'Load'
Lab Report
While writing your report using the template provided, be sure to include these bullet points in addition to the other information required.
- Provide photos of solubility tests
- Provide photos of dye extractions
- Provide photos of TLC
- Show calculations for Rf values
- Provide photos of samples and clearly indicate which TLC spots are associated with each
- Provide spectra that have been created in Excel with properly scaled and labeled axes
- Annotate spectra with functional group assignments to the best of your ability
- Using reference tables provided online or in the manual, explain what you know about your fabric sample
References
ASTM Standard E227, 2002, “Standard Guide for Forensic Examination of Non-Reactive Dyes in Textile Fibers by Thin-Layer Chromatography", ASTM International, West Conshohocken, PA, 2002.
Identification of textile fibres, Max Houck (ed) Woodhead Publishing, Cambridge, 2009, pp 203- 223
Media Attributions
- Fiber Classifications © Charlie Williams
- TLC © Charlie Williams
In chromatography, a solid or viscous liquid that interacts with an analyte as it is carried by the mobile phase
In chromatography, a gas or liquid that carries a sample or analyte across a stationary phase
