
1 Determining Concentration of Regulated Food Dye
Introduction
Purpose
Determine the concentration of Yellow #5 in a beverage sample using UV-Vis spectroscopy.
Food Dye
Dyes are common additives in our food, drugs, and cosmetics and are typically regulated to varying degrees across the world. These regulations can span from simply requiring the dye be declared on the label to being banned altogether in any product designed for human use.
Studies on many dyes in food claim to show undesirable effects from human consumption that range from sensitivity/allergy to behavioral alterations to severe health risks. Forensic scientists are not charged with determining the validity of these claims by assessing the amount of literature, quality of the studies, or soundness of inferences drawn. However, food companies are increasingly applying some forensic science investigations for a variety of reasons, as discussed in the article “Food Forensics: Investigating Food Crime” published by the Institute of Food Technologists.
“Companies undertake food forensic investigations for many reasons, such as to identify problems that may have affected the quality and safety of their products, to respond to consumer complaints or problems found in routine quality control testing, and to protect the companys reputation and liability. The problems may involve the presence of foreign materials and contaminants in raw materials and finished products; off-odors, off-flavors, and appearance problems; microbial spoilage; foodborne illness; and intentional adulteration to cause harm or to defraud for financial gain.”
Current regulation in the U.S. dictates that Yellow #5 (tartrazine) is acceptable in food, drugs, and cosmetics, but all products created or imported that contain Yellow #5 must declare its presence on the label (21CFR201.20). The FDA sometimes detains imported products that may contain Yellow #5 without declaring it.
UV-Vis Spectroscopy
UV-Vis spectroscopy is used to measure how much light is absorbed by a substance. It is not a particularlyspecific analytical technique in that it is not useful for identifying unknown compounds. It is pretty useful as aquantitative technique, however, for unknown concentrations of known substances. UV-Vis analysis typically takes less time and is easier to use than other quantitative techniques you’ll use later in this course. That makes it an ideal technique to use in this experiment which is primarily designed to test the accuracy of your solution preparations, practice generating a standard addition calibration curve, using that curve to calculate the concentration of an unknown, and statistically comparing your results to those of your peers.
Solution Calculations
Working Solution
You’ll have access to a stock solution of 6.0 mM tartrazine and will need to make a working solution to use for your analysis. You’ll also need to know the concentration of your working solution for further calculations.
When you see a ratio dilution, like 1:20, 1 = number of parts of what we are diluting and 20 = total number of parts. So, a 1:20 dilution would mean 1 part concentrated solution + 19 parts of solvent for 20 parts total.
Furthering this example, how would we make a 100 mL 1:20 dilution in water? We can find this by dividing the total desired solution volume by the total number of parts (100 mL/20 parts= 5 mL/part) and multiplying that answer by the number of parts of the concentrated solution (1 part*5 mL/part = 5 mL). Once we have the amount of concentrated solution, the remaining volume will be made up with water (100 mL total – 5 mL conc.= 95 mL water). So, a 100 mL 1:20 dilution would require 5 mL concentrated solution and 95 mL water.
Standard Addition
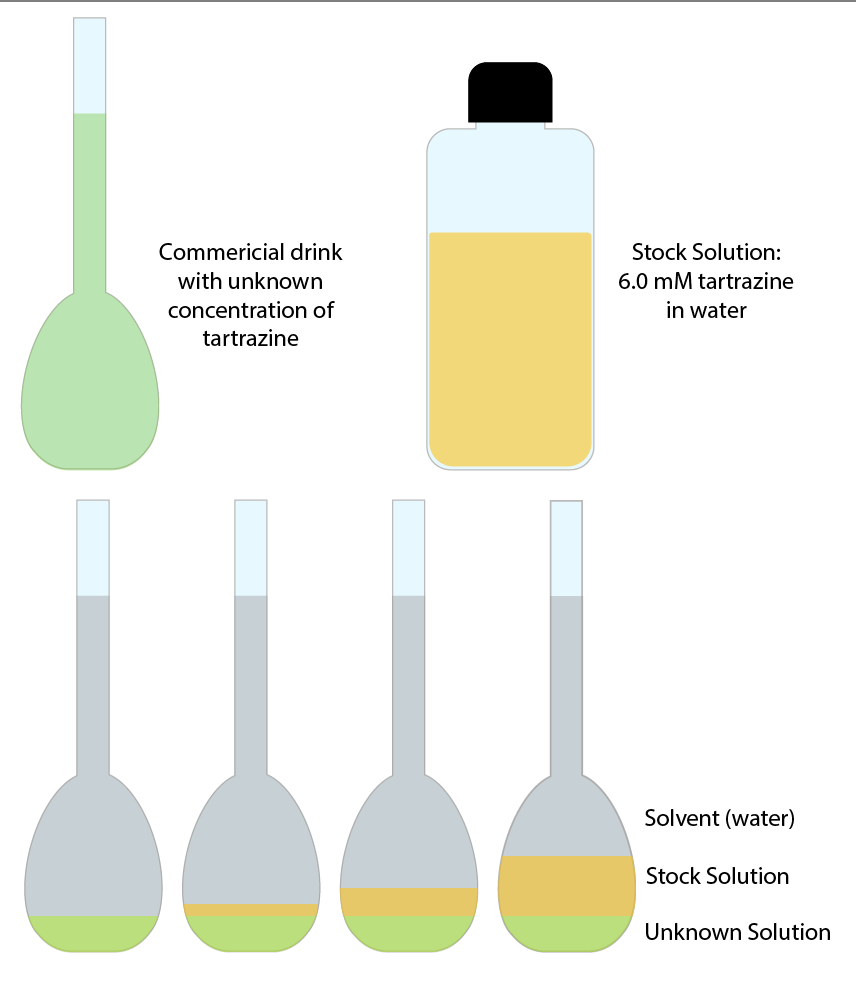
When working with complex matrices like commercial drink products, we have to account for all of the other components that may interfere with our analysis (in this case, there are a lot of other components that may absorb at the same wavelength as tartrazine). Therefore, we’ll need to use a standard addition method so we can account for these matrix effects.
The standard addition method calls for adding our working standard solution to small aliquots of our unknown. This means each of our calibration solutions will contain some of our beverage sample, and therefore have more comparable matrix effects. See the image in Figure 1 for a visual representation of standard addition solutions.
This example data in Table 1 was obtained by adding increasing aliquots of the 1:5 working solution to small, equal amounts of beverage sample. The final volume of each solution was brought to 3 mL with DI water. The final dilution of the beverage was 1:4 in this example.
| Concentration of Known Tartrazine Added to Diluted Drink Sample (?M) | Absorbance at 422 nm |
| 0 | 0.043 |
| 5 | 0.135 |
| 10 | 0.275 |
| 15 | 0.387 |
| 20 | 0.512 |
| 25 | 0.615 |
The concentrations in the table are the concentrations ofaddedtartrazine (i.e. – the diluted concentration of our added working solution).
Make a scatter plot in Excel with a trendline and obtain the equation for the trendline and R-squared correlation coefficient.
The total concentration of tartrazine would be:
![[tartrazine]_{total} = \frac{V_{sample} *[tartrazine]_{sample} + V_{added-working-solution}*[tartrazine]_{working-solution}}{V_{total}}](https://openbooks.library.unt.edu/forensicchemlabmanual/wp-content/ql-cache/quicklatex.com-3c25977e2df4a76fd90bcda7cfc0e43d_l3.png "Rendered by QuickLaTeX.com")
The absolute value of the x-intercept (y=0) of this line will be the concentration of tartrazine in thediluted sample.
The concentration of tartrazine in the undiluted sample can then be obtained:
![[tartrazine]_{sample} = [tartrazine]_{diluted-sample}*dilution factor](https://openbooks.library.unt.edu/forensicchemlabmanual/wp-content/ql-cache/quicklatex.com-82836f257c1d672e09a448e2e1b125c7_l3.png "Rendered by QuickLaTeX.com")
Pre-Lab Questions
- How much tartrazine would be required to make 200.0 mL of the 6.0 mM stock solution?
- How much stock solution do you need to make 50.0 mL of a 1:5 working solution of tartrazine?
- What is the concentration of the 1:5 working solution?
- How much 1:5 working solution would we need to add to each solution to obtain the standard concentrations in the table?
- What is the concentration of tartrazine in the example beverage sample in Table 1?
Materials and Methods
Supplies (Part 1)
- 50 mL volumetric flask
- Cap for volumetric flask (or alternate storage vessel)
- 6.0 mM stock solution of tartrazine (available from TA)
- D.I. water
- Labeling tape and marker
Procedure (Part 1)
Create a Working Solution of Tartrazine
- Read and sign the safety form provided by the TAs.
- Using your pre-lab calculations, obtain the appropriate volume of the provided 6.0 mM stock solution of tartrazine.
- Add this to a 50 mL volumetric flask and dilute to the line with D.I. water.
- Label your flask with both of your initials, the contents and concentration, and the date.
- Store this solution in the flask with a cap until Day 2.
Supplies (Part 2)
- Working solution from Day 1
- Glass test tubes
- ~50 mL of decarbonated soda
- D.I. water
- Spec-20 spectrophotometer (shared)
Procedure (Part 2)
Determine Necessary Dilution of Soda
First, you’ll need to figure out how dilute your soda needs to be. This can be accomplished by trying out multiple dilutions until you reach a desired absorbance.
For this section, the lab will gather into two large groups, each with a TA. The TA and/or student volunteers will perform trial dilutions of decarbonated soda. Be sure to record the results in your notebooks along the way.
Blank the Spectrophotometer
- Turn on the spectrophotometer and allow to warm up, if necessary.
- Set your wavelength to 422 nm.
- Fill a test tube with 3 mL of water – this is your blank.
- Insert the test tube with water into the sample holder.
- Blank the spectrophometer by setting the absorbance to 0 with the water in the sample holder.
Trial Dilutions
Starting with a 1:2 (1 in 2) dilution, perform trial dilutions until an absorbance value of 0.060 is reached.
- Dilute in a glass test tube to a total volume of 3 mL.
- Mix the solution well prior to analysis.
- Use a spectrophotometer to analyze the diluted soda and record the result.
- Repeat with increasing dilutions with a total volume of 3 mL until desired result is obtained.
- Record the volume of soda required to obtain an absorbance value of 0.060 to use in the next step.
Standard Addition Solutions
Work with your lab partner on this section. Each pair will prepare and analyze their own standard addition solutions.
- Add the volume of decarbonated soda determined in the last section to a glass test tube.
- Dilute to 3 mL with water and mix well.
- Add the same volume of decarbonated soda to 5 other test tubes.
- Add enough of your working solution to each test tube to create solutions of 4 ?M, 8 ?M, 16 ?M, 24 ?M, and 40 ?M tartrazine.
- Dilute the solution in each test tube to 3 mL and mix well.
- Obtain absorbance values for each solution, starting with the soda/water only dilution and working from most dilute to least dilute.
- It’s advised to make a quick plot of absorbance vs. [tartrazine] to roughly check your work before leaving lab to ensure linearity.
- Share your absorbance data with the TAs so they can disseminate to everyone.
Lab Report
While writing your report using the template provided, be sure to include these bullet points in addition to the other information required.
- Provide data for determining soda dilution.
- Show a plot of your experimental results with the trendline, equation, and R2 value.
- Calculate the concentration of tartrazine in the undiluted soda.
- Calculate the mean, standard deviation, and coefficient of variance for data from your section for each known solution and indicate if your values lie within the 95% CI.
- Be sure to show how calculations were performed (if the same calculation is performed multiple times, you only need to show the equation once)
References
“Food Forensics: Investigating Food Crime”, Neil H. Mermelstein, 2018. Institute of Food Technologists. www.ift.org
“Why is That Drink Yellow?”, Ted Gries, 2019. Beloit College. chem.beloit.edu
Media Attributions
- Standard Addition © Charlie Williams
